 Djinious


Supply chain
Demand joined to stock in SQL, the reorder policy in one readable node, suppliers graded on what they actually delivered, and every cold-chain excursion on a map.
 DjiniousWorkflow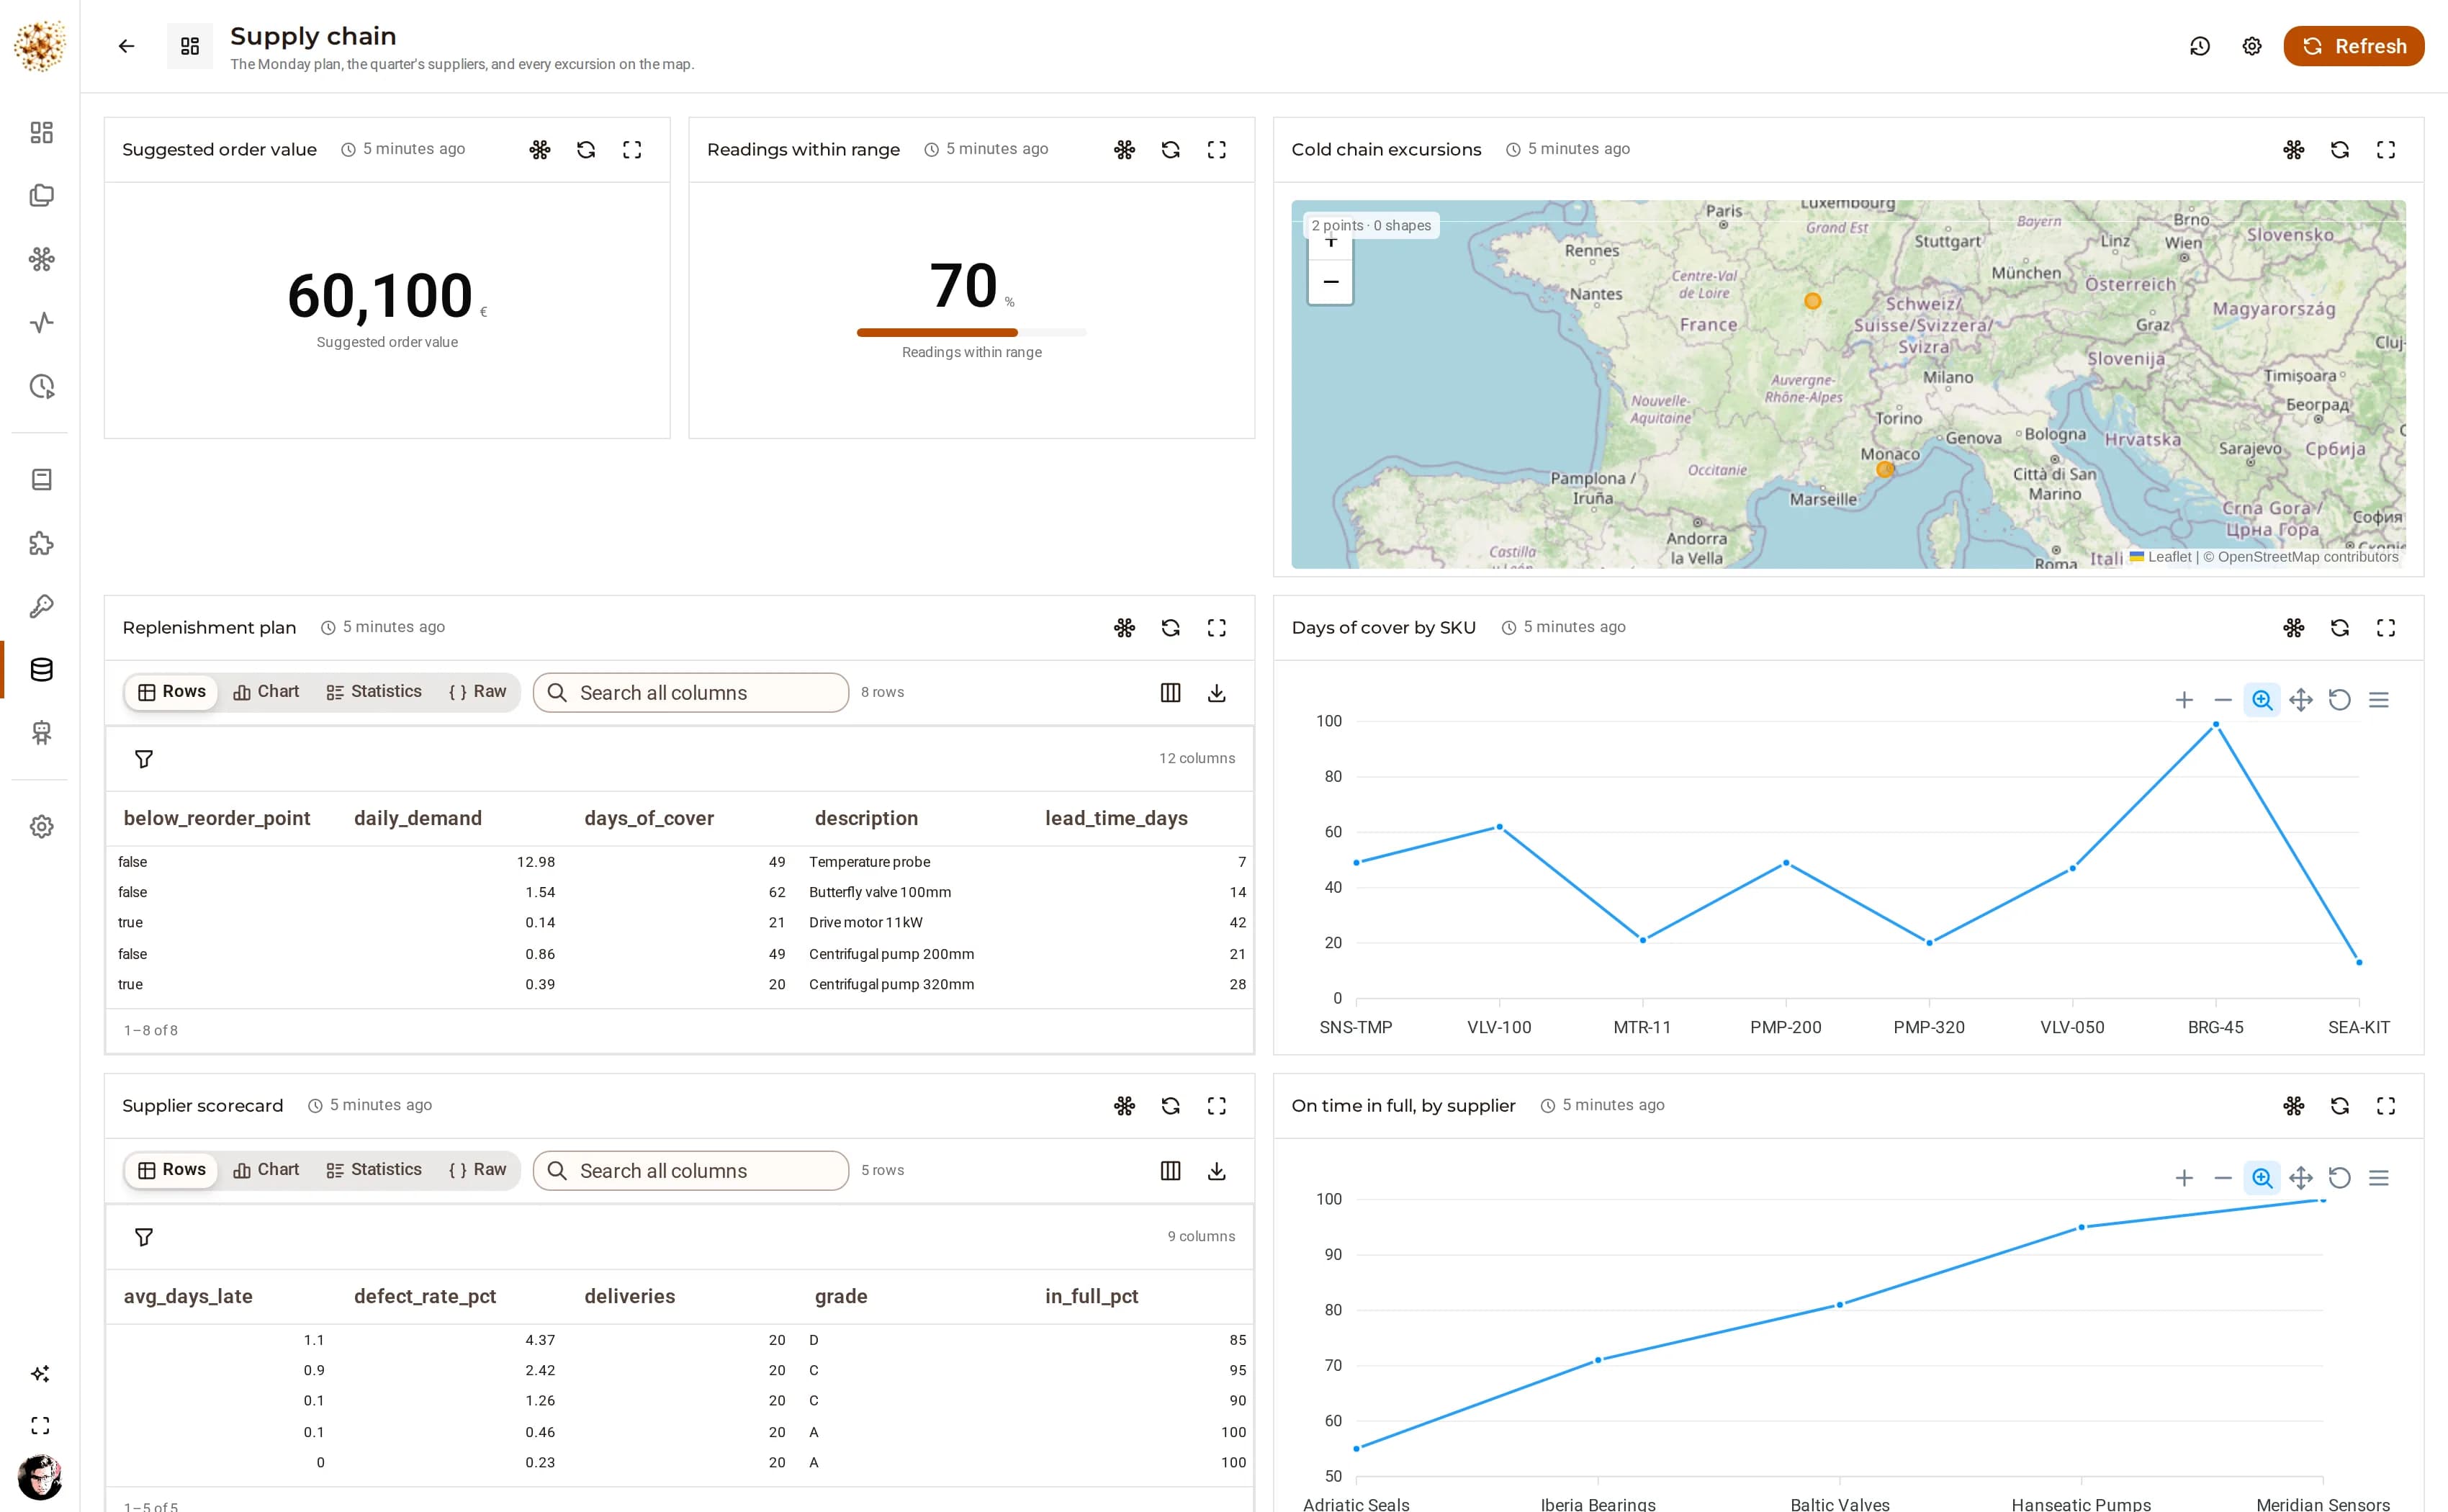
SQL · policy in one node · maps
Eight weeks of demand joined to stock on hand — in SQL, because that is what SQL is for — and then the policy: lead-time demand, safety stock, order multiples, days of cover. That split is the point. The query is a query; the thing a planner argues about is one node they can read.
Every line below its reorder point becomes a draft purchase order you can open, and the plan is a page by the time the planner sits down. The scorecard hands the model numbers it did not compute and asks for a recommendation against a schema.
The replenishment plan, full page
DjiniousWorkflow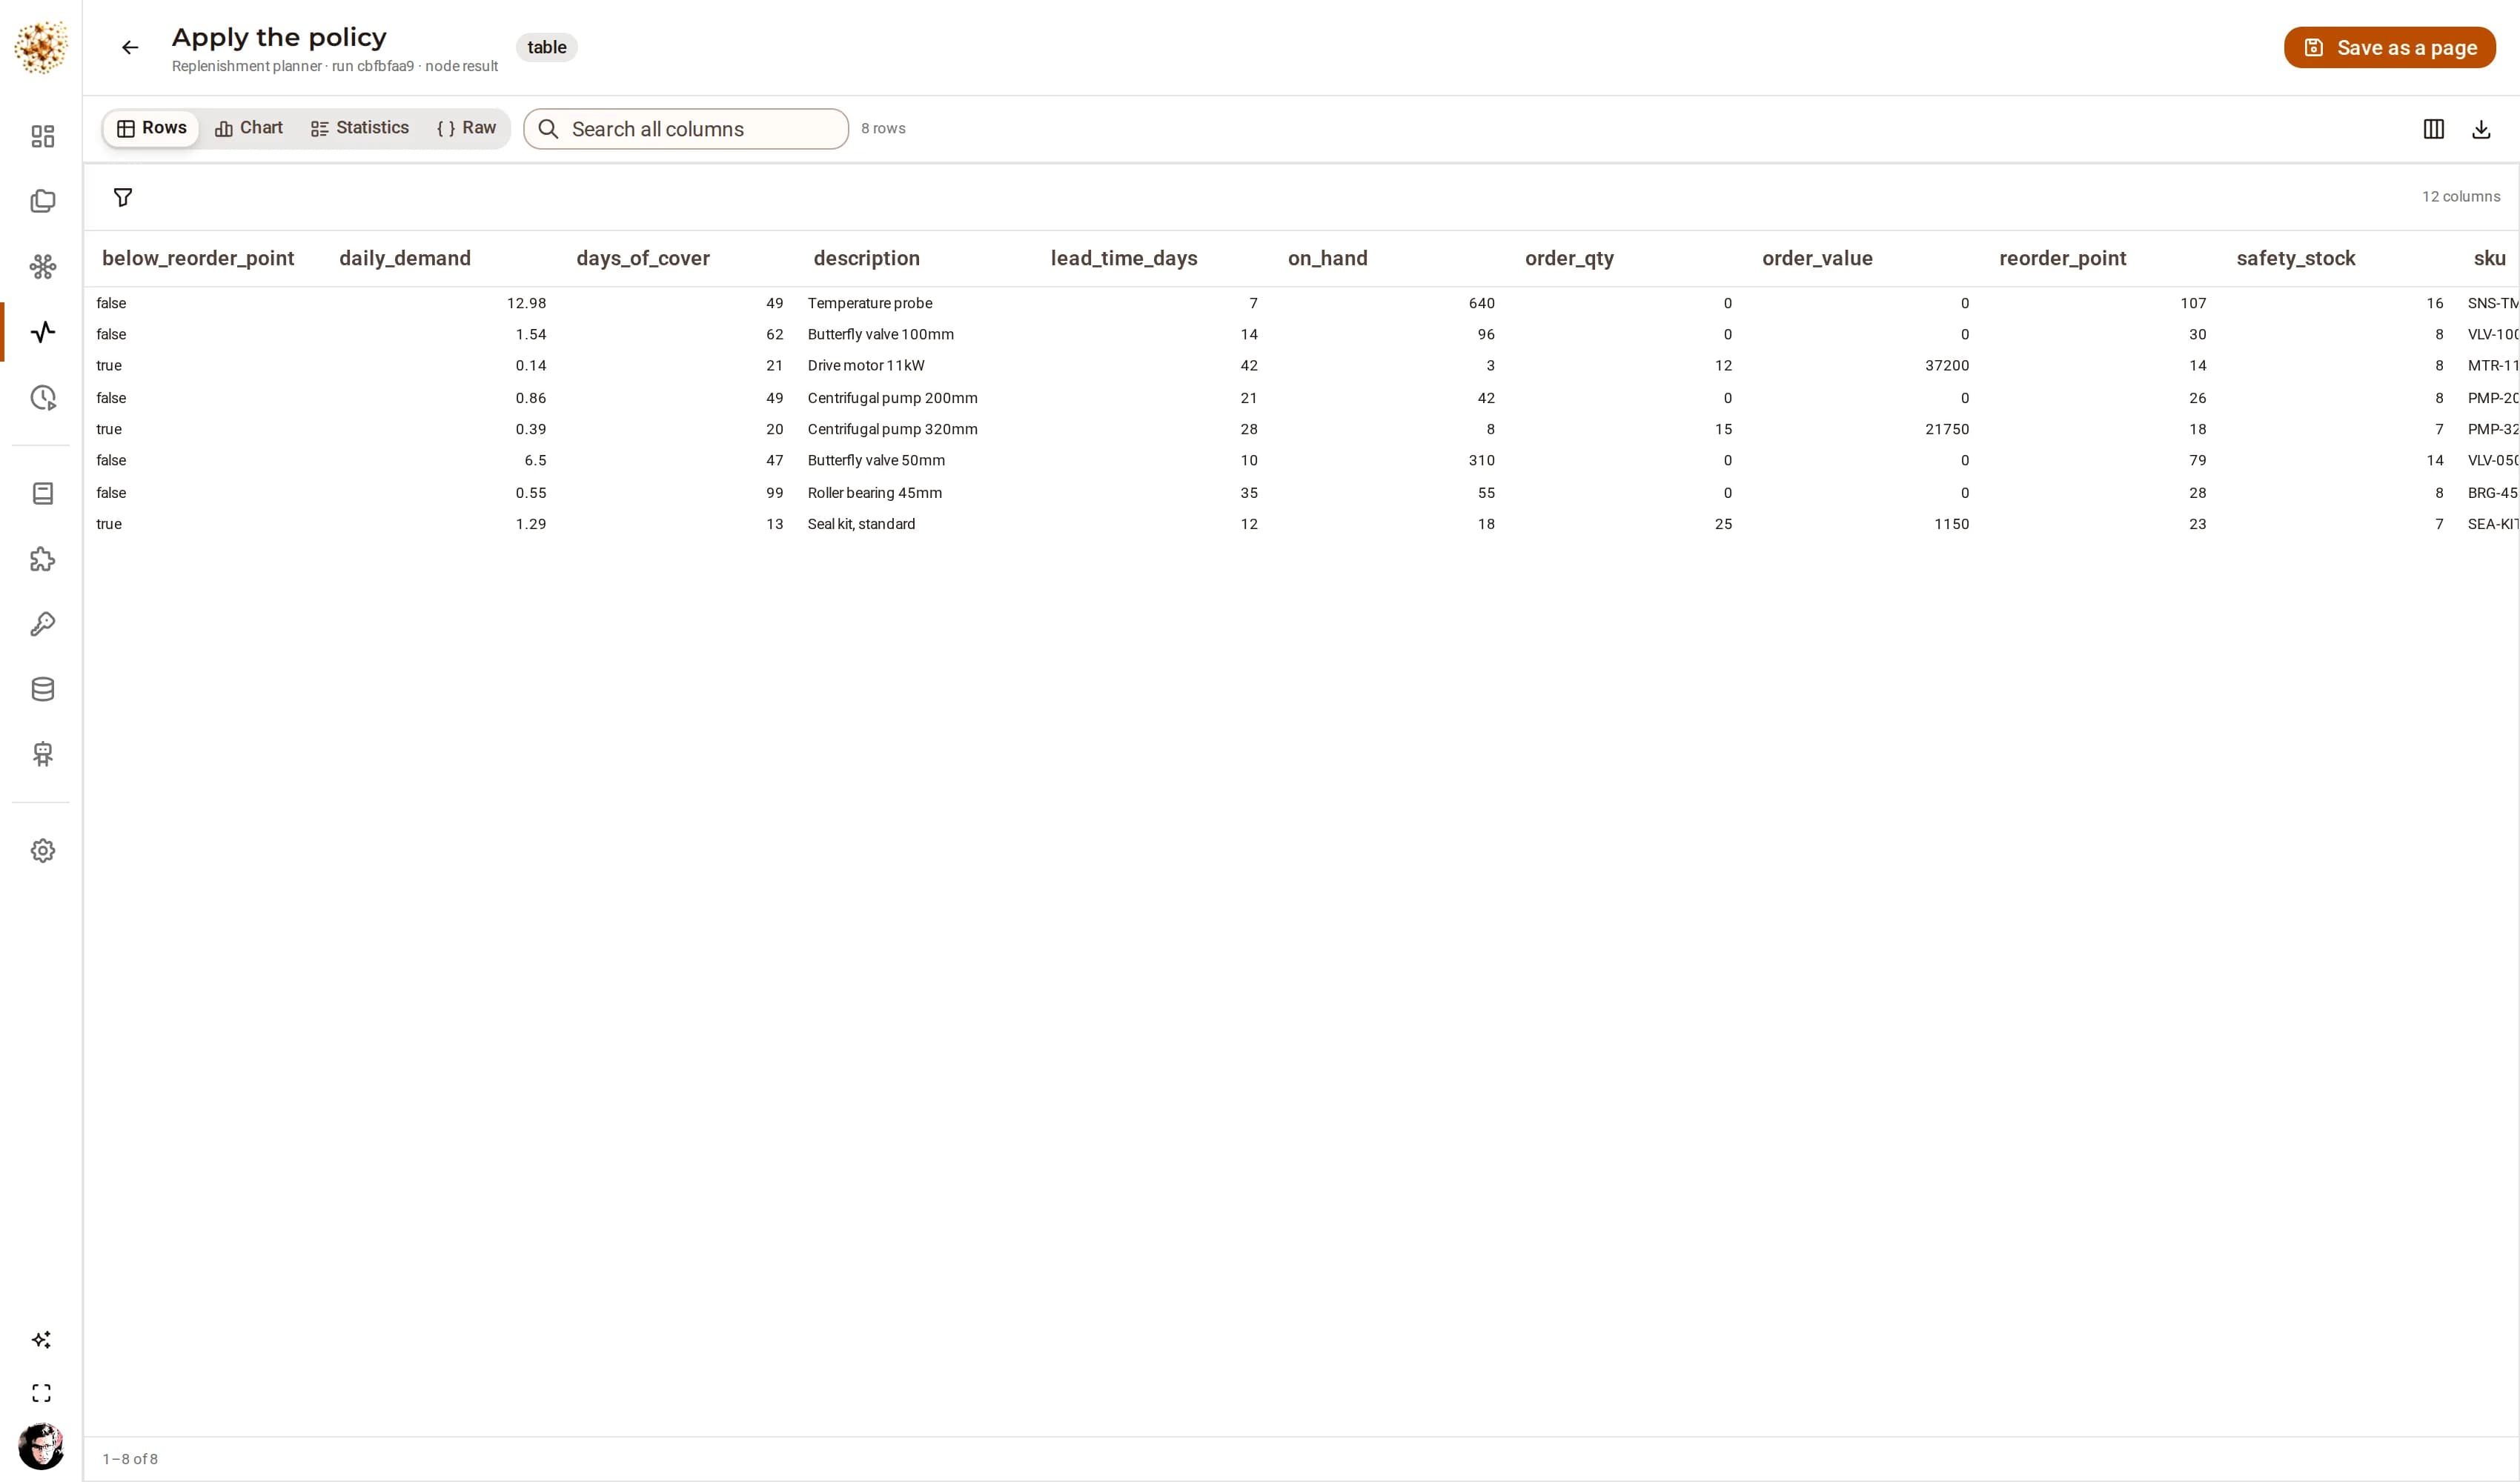
How the graphs run
A join and a group-by in the database
The policy in a node beside it.
A draft order raised per line
As a record in your own ontology.
OTIF and defect rate computed by the graph
The recommended action asked of a model.
Temperature excursions
Plotted at the point where each one peaked.
On the canvas
sql:sqliteQuery · frame:* · ai:extract · views:map · entities:create
It ships with the product
This project ships with DjiniousWorkflow. One command seeds it, another runs every graph in it, and the captures here came out of those runs.
Where a graph leans on a fixture rather than a live system, it reads the fixture where your deployment would read a database — swap the node at the top and the rest of the graph does not change. The engine work — the fan-out, the gather, the approval, the publish — is the product’s own.
Keep exploring
Related use cases
 DjiniousDataMaster dataOne customer view from four systems that disagreeCluster the records that describe the same organization, and keep the ones you are not sure about out of the merge.DjiniousDataSite monitoringCounting what a camera sees, not what it detectsObject detection over photos, footage and live streams, materialised as metrics you can alert on.DjiniousData