 Djinious
Normal
FFT: 0.942 · STFT: 0.802 · CWT: 0.755 · DWT: 0.749
The platform
Each application does one part of the work — and hands its evidence to the next. Use them together, or one at a time.
Platform overviewSee how the loop runs DjiniousEngineeringOrchestration
 DjiniousLabModelling & simulation
 DjiniousWorkshopSystem integration
 DjiniousSafeCertifiable code
 DjiniousWorld3D replicas
 DjiniousMapAgent GIS
 DjiniousCCOperations & SCADA
 DjiniousDataKnowledge base
 DjiniousWorkflowAgent automation
A single standoff microphone and a continuous-wavelet-transform diagnostic stack on a substation power transformer — time-frequency signal processing, a six-family feature bake-off, and a health-index / RUL prognostics pipeline with honestly measured uncertainty, reported with the misses left in.
 DjiniousLab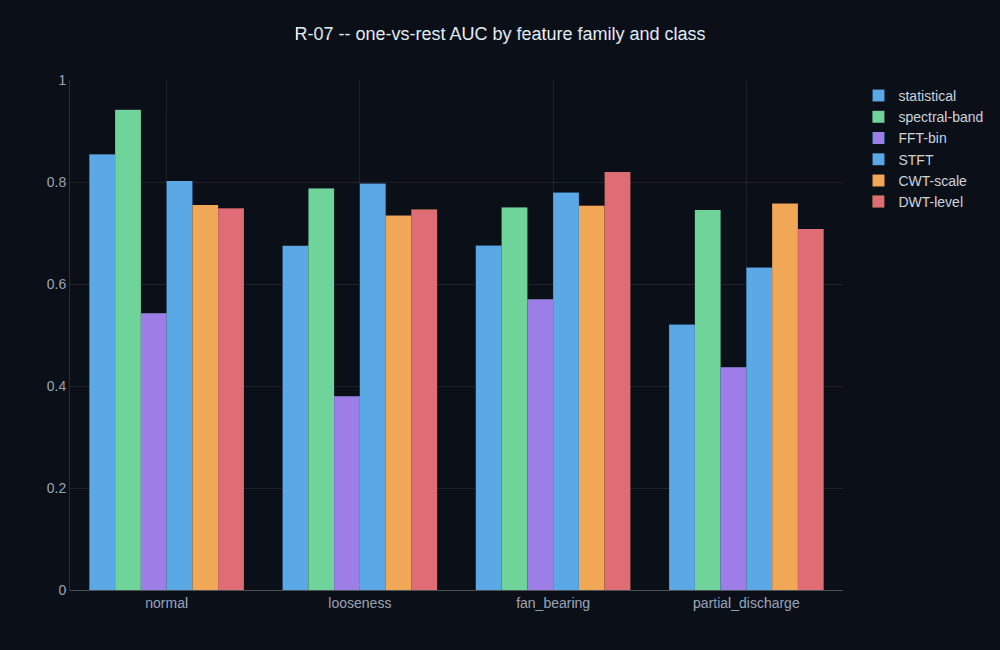
A single standoff microphone, three meters from an oil-immersed power transformer's tank wall, feeding a continuous-wavelet-transform diagnostic stack. Where a stationary Fourier transform blurs a microsecond partial-discharge burst across an entire averaging window, the CWT localises it to the millisecond — and a health index with honestly measured uncertainty and a remaining-useful-life estimate turn that signal into a maintenance decision, with the classes where wavelets don't help reported as plainly as the one where they do.
Every recording in this program is generated, not captured — a physics model of five acoustic mechanisms (core magnetostriction, winding Lorentz force, and three fault modes) convolved through a validated three-mode tank-wall transfer path, at a declared 8.4 dB broadband SNR against switchyard ambient noise. Everything downstream of that recording — the transform, the features, the classifiers, the health index, the prognosis — is real code operating on those samples; replace the recording step with a real sensor and nothing downstream changes. The health index's own 90% split-conformal interval, the gate built specifically to test whether its stated uncertainty is honest, covered 82.5% of held-out cases (n=63) — reported as a FAIL in the verification notebook and the program dossier, not rounded up. The remaining-useful-life trajectories are simulated monthly health-index snapshots from the same physics model, not longitudinal field data, so the 81.3% RUL coverage figure above is a property of the estimator applied to a simulated trajectory, not a claim about real transformer wear. No claim on this page substitutes for field validation.
DjiniousLab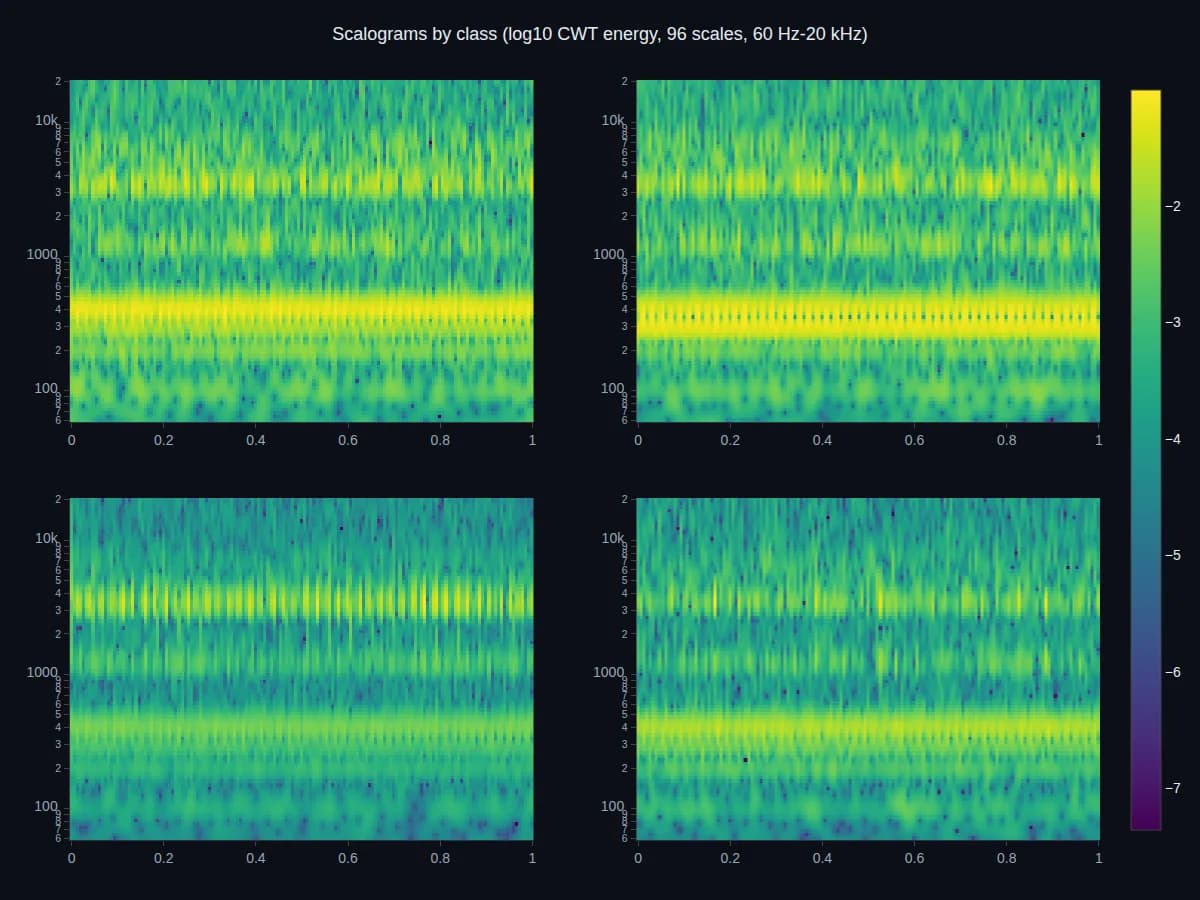
AUC values from notebook 06's held-out bake-off: one Mahalanobis-distance classifier, scored per class against six feature families on the same 234-record dataset (117 records fit each family's per-class Gaussian, the other 117 held out and scored — never both for the same record). The FFT column shows the strongest Fourier-derived family, spectral-band — consistent with how the R-07 gate itself is scored, against the strongest Fourier family rather than the weakest. CWT-scale wins the partial-discharge class outright among all six families measured — but spectral-band trails it by only 1.3 AUC points, short of the ≥10-point margin the program's own gate requires, which is measured as a FAIL, not rounded up. On the three stationary classes, CWT does not win at all.
FFT: 0.942 · STFT: 0.802 · CWT: 0.755 · DWT: 0.749
FFT: 0.787 · STFT: 0.797 · CWT: 0.734 · DWT: 0.746
FFT: 0.750 · STFT: 0.779 · CWT: 0.753 · DWT: 0.820
FFT: 0.745 · STFT: 0.633 · CWT: 0.758 · DWT: 0.708
DjiniousLab![A histogram of a 5000-draw parametric Student's-t RUL ensemble for a looseness-fault asset, peaking near 4.3 months, with a dashed line at the true RUL of 2.0 months and an 80% predictive interval of [3.3, 5.7] months](/_next/image?url=%2F_next%2Fstatic%2Fmedia%2Facoustic-rul.3i_01rvtlc6ll.png&w=3840&q=75)
Keep exploring
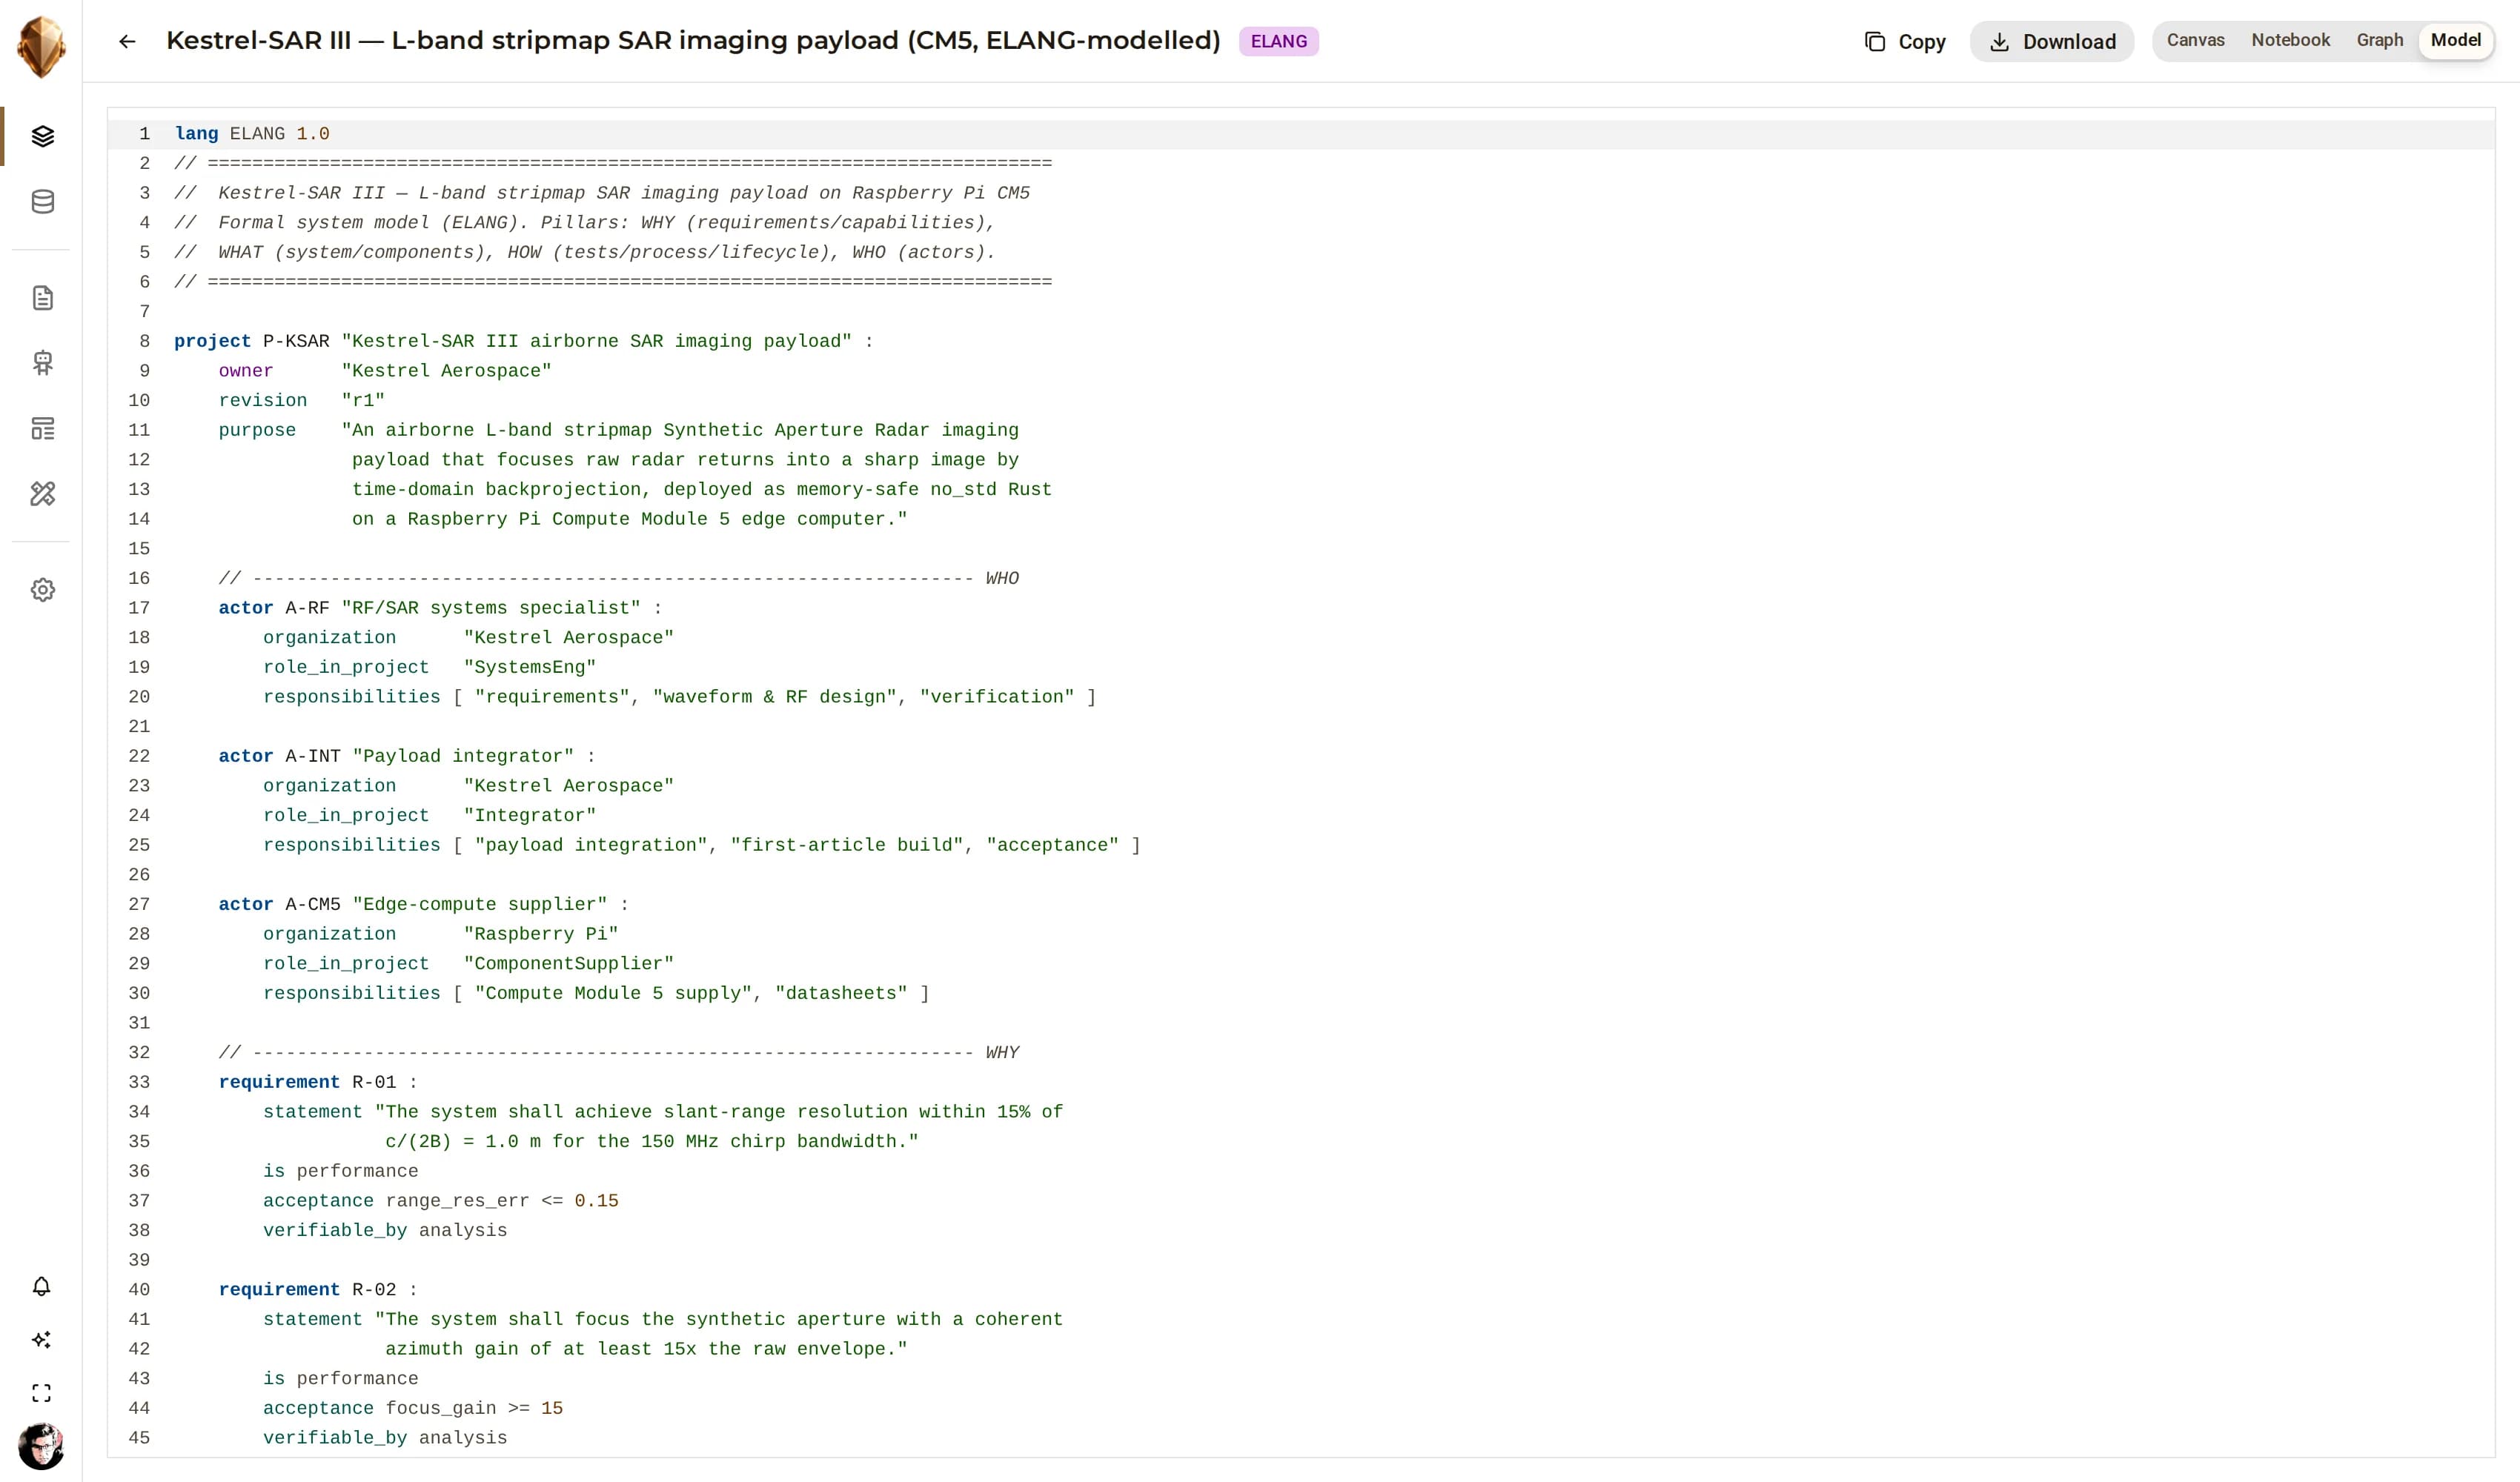 Industrial roboticsKronos Robotic Work CellA six-axis robotic work cell modelled end to end in ELANG as an audited reference — roughly a thousand lines carrying a functional-safety design to ISO 13849-1 Performance Level d, with every safeguard traced to the hazard it mitigates.
 DjiniousEngineering
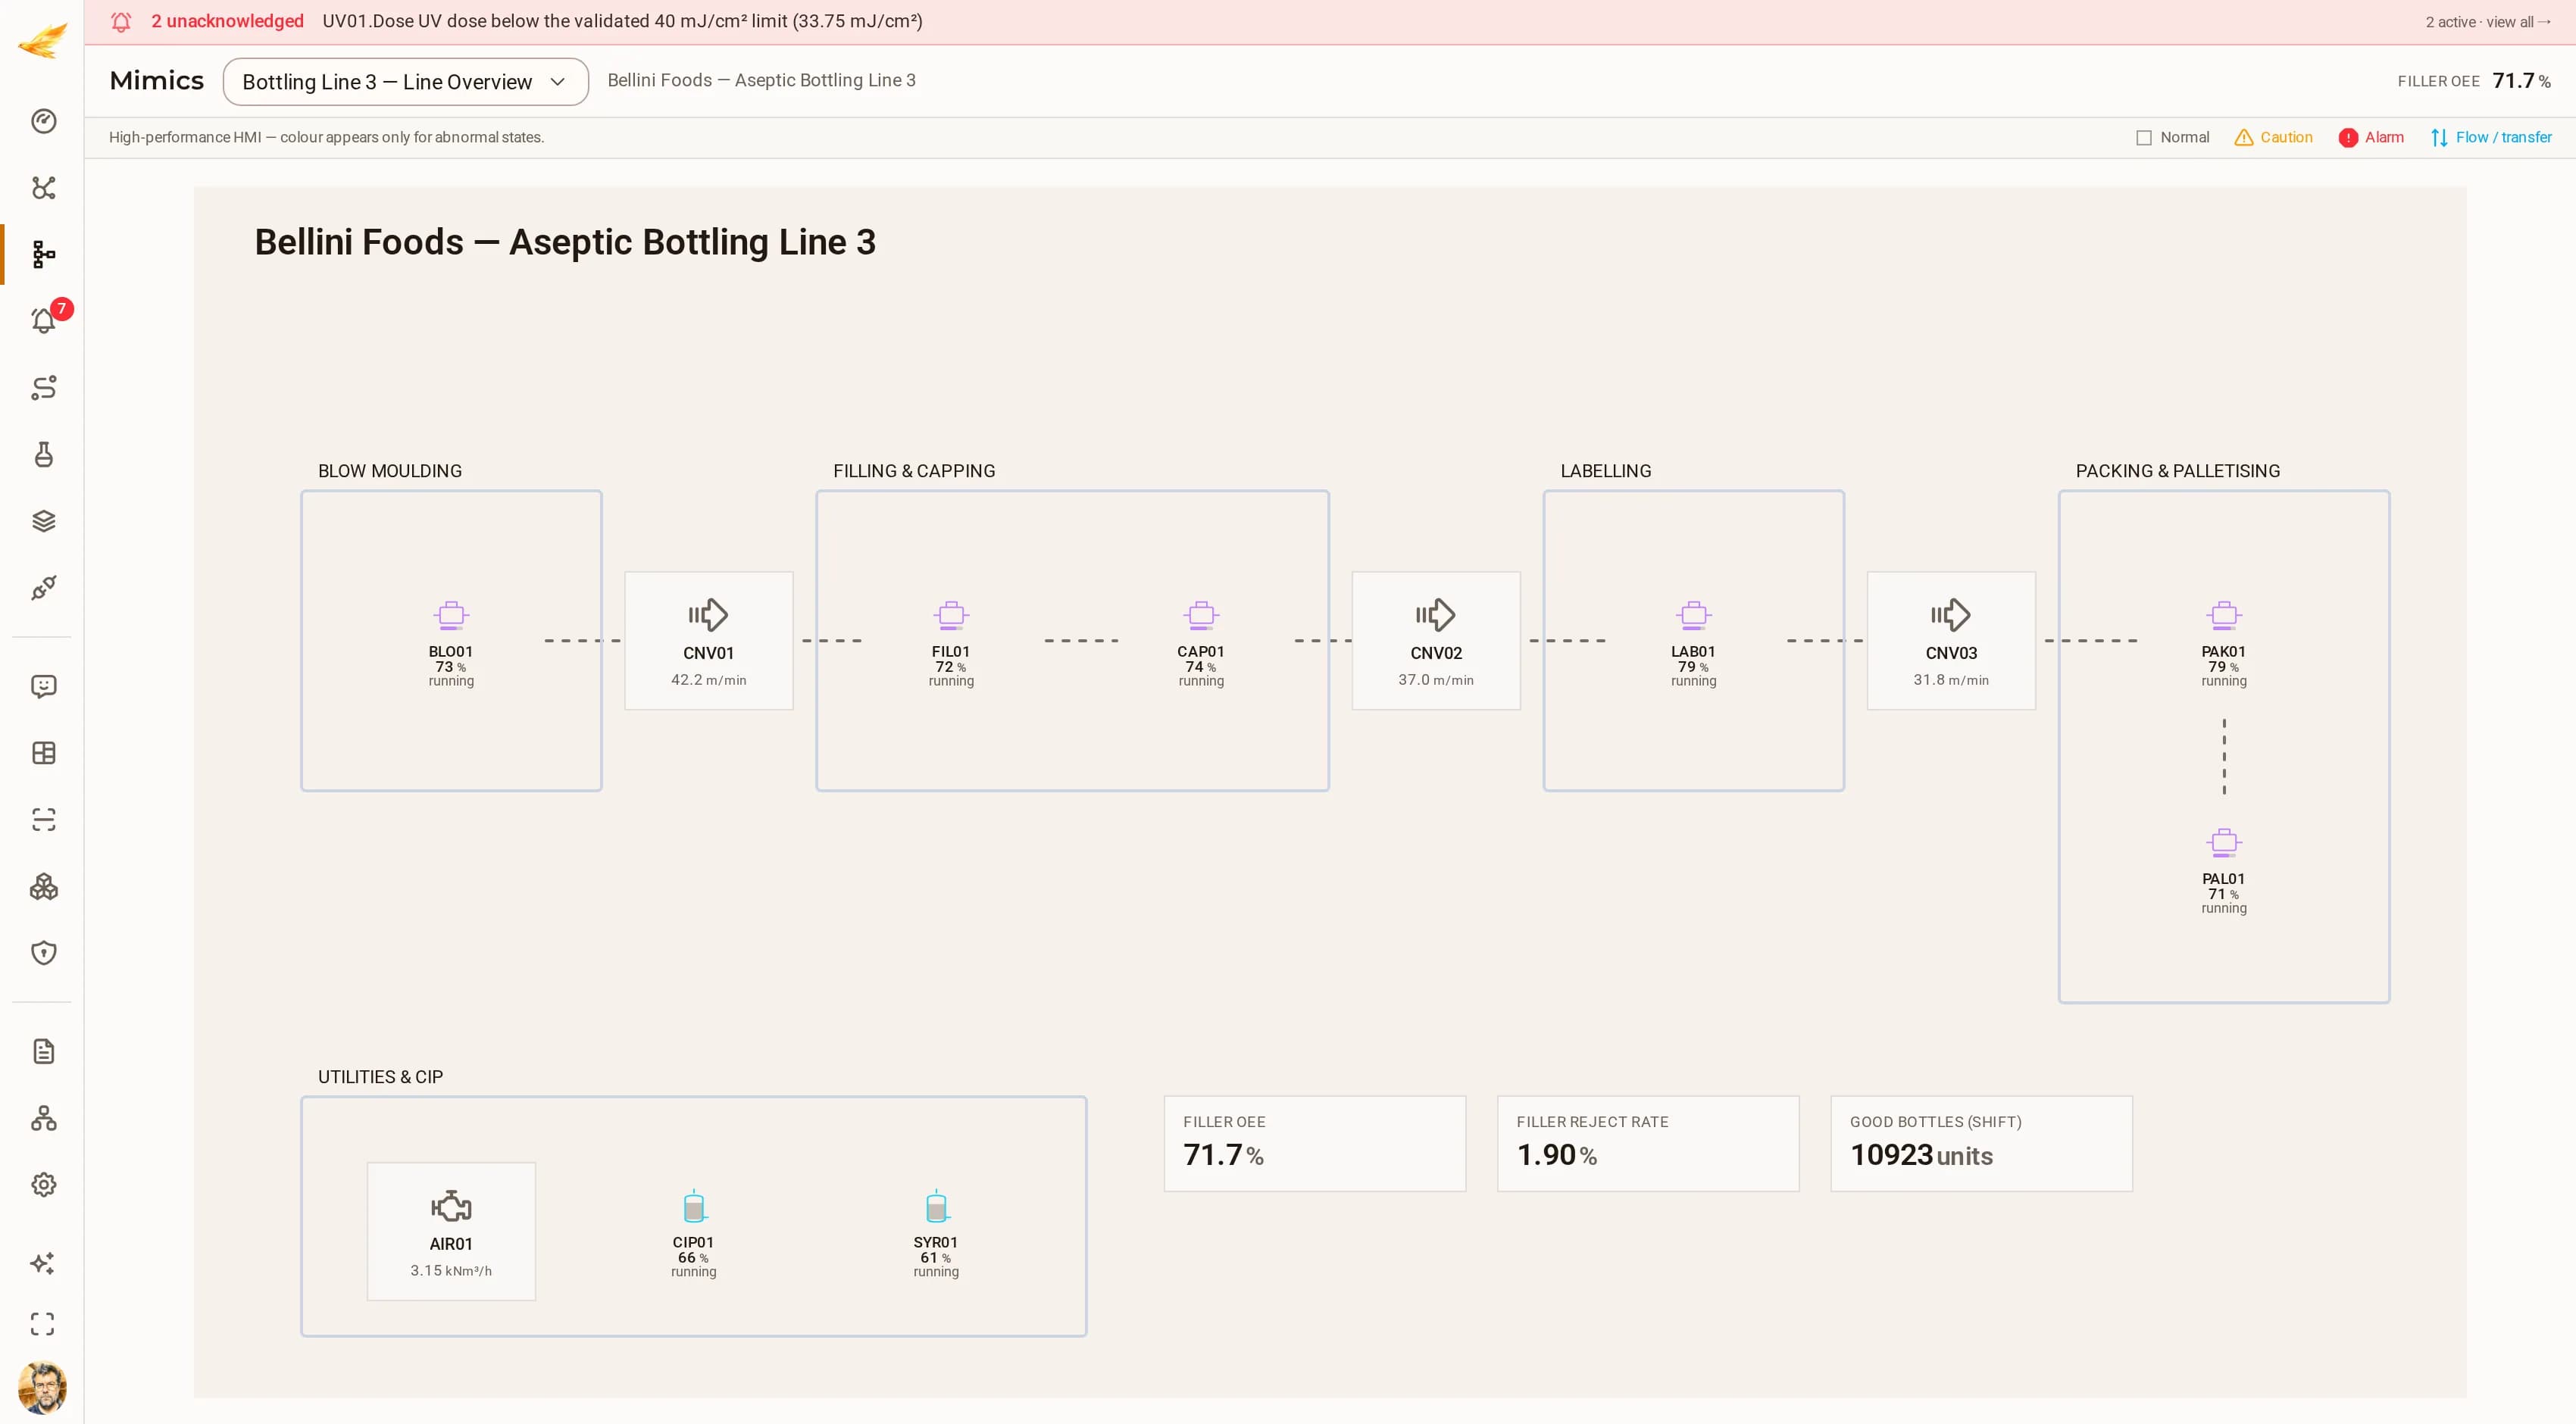 Food & beverage manufacturingBellini Foods — Aseptic Bottling Line 3A 24 000 bottles/hour aseptic PET line: blow moulding, aseptic filling, capping, labelling, case packing and palletising, with live OEE on every machine and its own utilities and CIP block.
 DjiniousCC
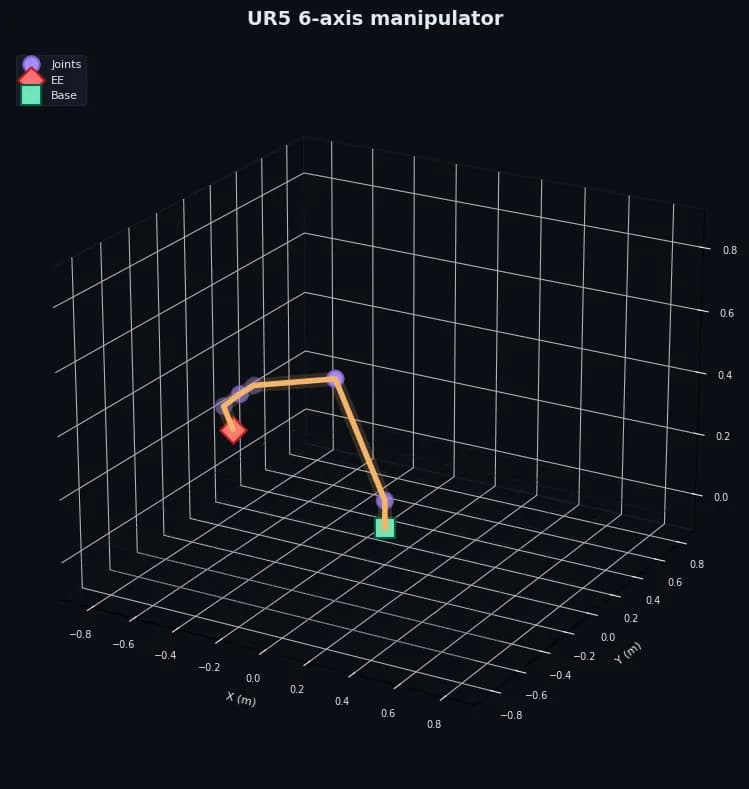 Industrial roboticsUR5 6-axis manipulatorA spatial 6-DoF UR5 arm as one multibody model — closed-form inverse kinematics driving a Cartesian end-effector path through per-joint PD control with gravity feedforward.DjiniousLab