 Djinious




Hydrogen fuel cell
A PEM fuel cell from the electrochemistry up — the polarization curve and its three overpotentials, power and efficiency, an automotive stack, hydrogen consumption, thermal management, and dynamic load response.
 DjiniousLab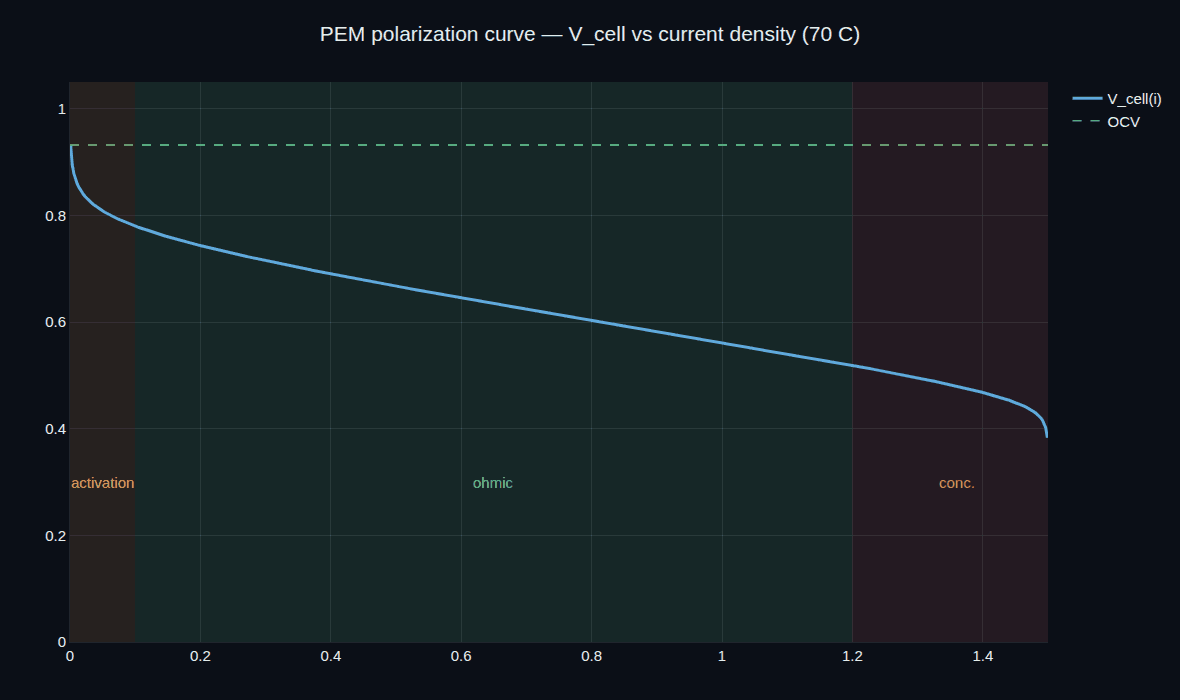
- peak power density
- 0.655 W/cm²peak power density
- efficiency at rated
- 43.9%efficiency at rated
- 200-cell stack @ 130 V
- 22.6 kW200-cell stack @ 130 V
- hydrogen consumption
- 1.4 kg/hhydrogen consumption
- steady operating temp
- 82 °Csteady operating temp
- design notebooks
- 10design notebooks
Hydrogen in, electricity out — and where the volts go.
A fuel cell turns hydrogen and air straight into electricity, with water and heat as the only exhaust — no combustion, no Carnot ceiling. But the voltage you actually get is always less than the thermodynamics promises, and exactly how much less is the polarization curve. This program builds a PEM cell from its electrochemistry, traces that curve and the three losses that shape it, scales it into an automotive stack, and runs the fuel, thermal and dynamic behaviour a real system has to manage.
No flame, no Carnot limit.
Because a fuel cell converts chemical energy to electricity directly, it isn't bound by the Carnot efficiency of a heat engine. The reversible cell voltage is 1.23 V and the thermoneutral voltage — where all the reaction enthalpy would become electricity — is 1.48 V, giving a thermodynamic ceiling around 83%. The catch is that you only see that voltage at zero current; the moment you draw power, three overpotentials start eating into it, and the polarization curve is the map of that erosion.
DjiniousLabDjiniousLab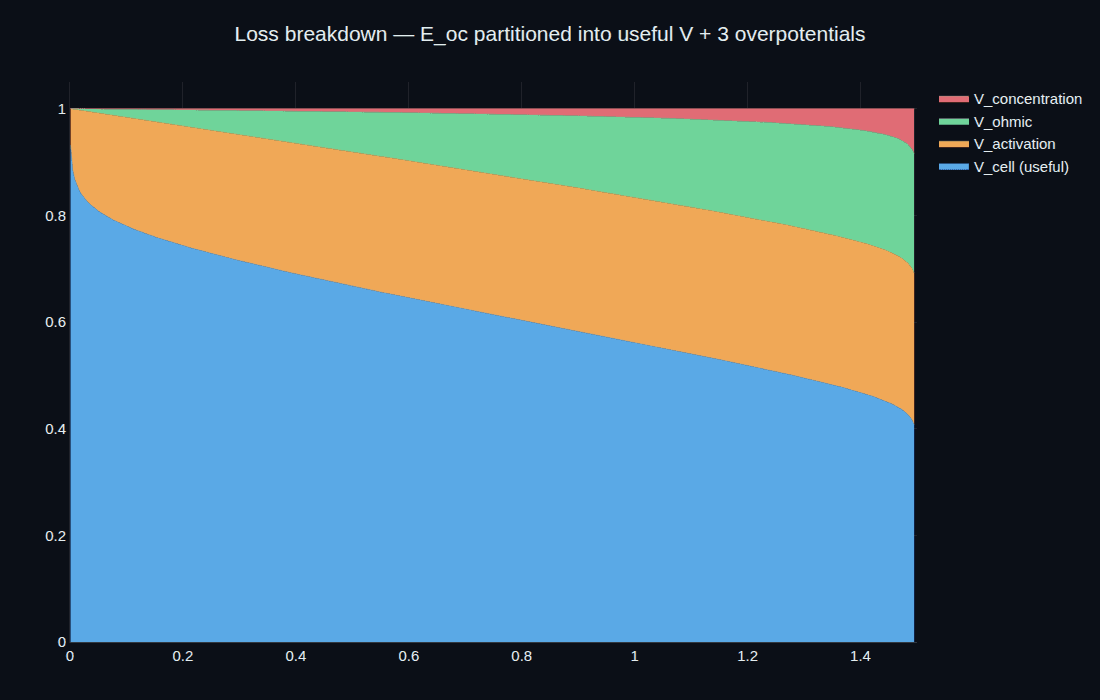
You can't have both at once.
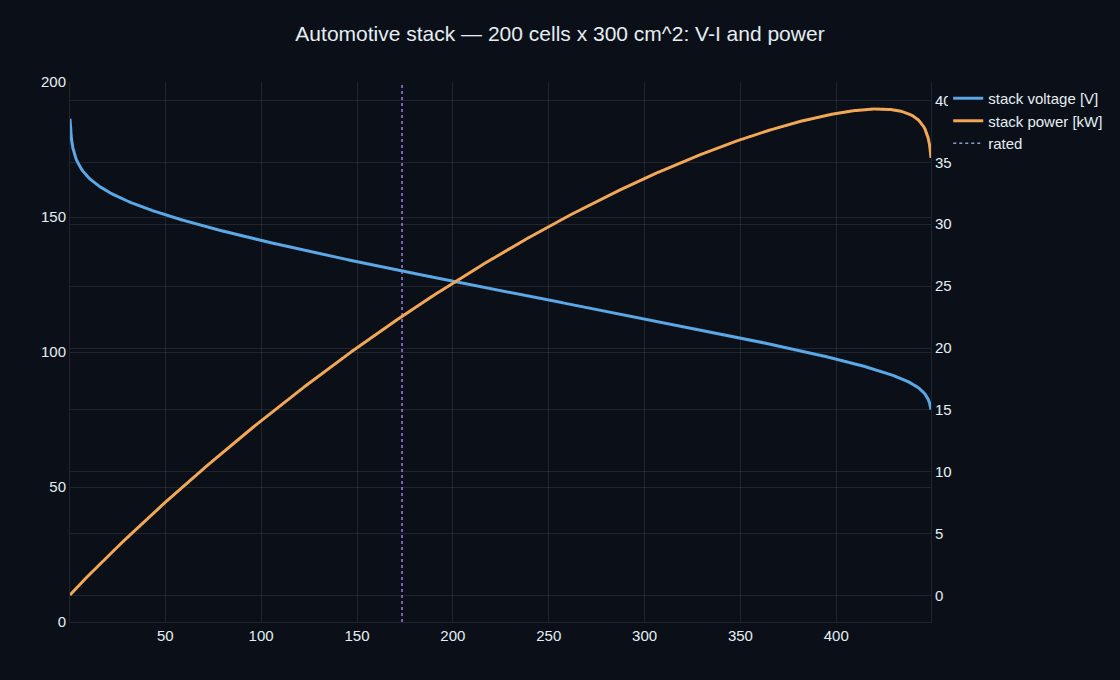
Power density is voltage times current, so it climbs as you draw more current — until the falling voltage wins and it peaks, here at 0.655 W/cm². But efficiency is just the cell voltage divided by the thermoneutral voltage, so it falls the whole way. That tension sets the rated point: run near peak power and the cell is small but inefficient and hot; run at high voltage and it's efficient but large. The program picks the rated point at 0.65 V — 43.9% efficient — and sizes the stack from there.
DjiniousLab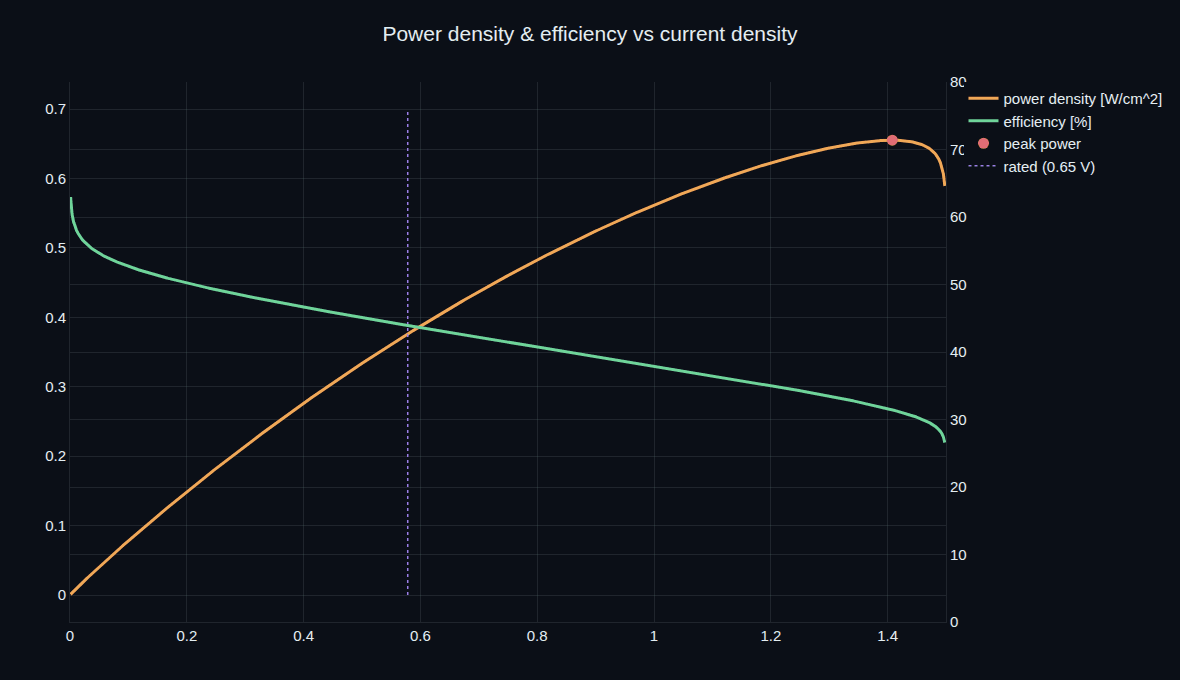 DjiniousLab
 DjiniousLab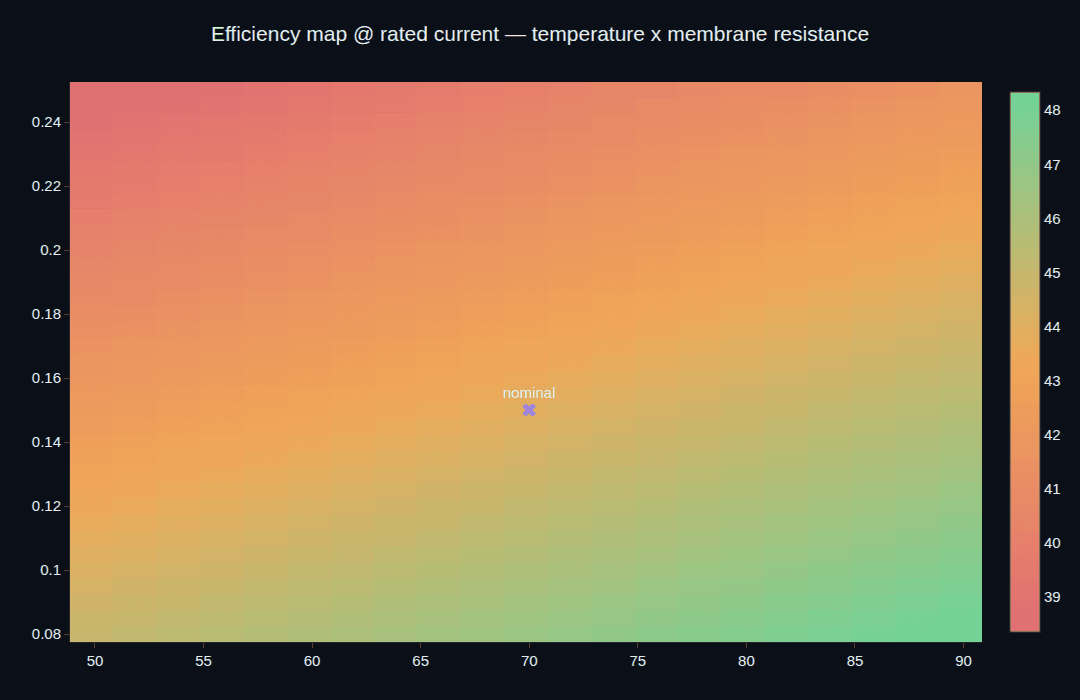
Every spec is a number you can re-run.
The sign-off notebook re-derives each requirement from the same electrochemical model the program builds.
Result
- Peak power density: 0.655 W/cm²
- Efficiency at rated: 43.9%
- Stack power: 22.6 kW @ 130 V
- Hydrogen consumption: 60.9 g/kWh
- Requirements verified: 6 / 6
Requirement
- Peak power density: R-01
- Efficiency at rated: R-02
- Stack power: R-03
- Hydrogen consumption: R-04
- Requirements verified: PASS
0-D, design-grade electrochemistry.
The cell is a 0-D, semi-empirical model — Tafel activation, ohmic resistance and a concentration term — not a 1-D membrane-and-gas-diffusion-layer transport model; the thermal node is lumped and the stack is treated as uniform. That is exactly the fidelity fuel-cell sizing and system design need first: drawing the polarization curve, choosing the rated point, scaling the stack, budgeting hydrogen and cooling, and checking the dynamic response — on your own catalyst, membrane and operating numbers, before a detailed transport or CFD model.
Keep exploring
Related use cases
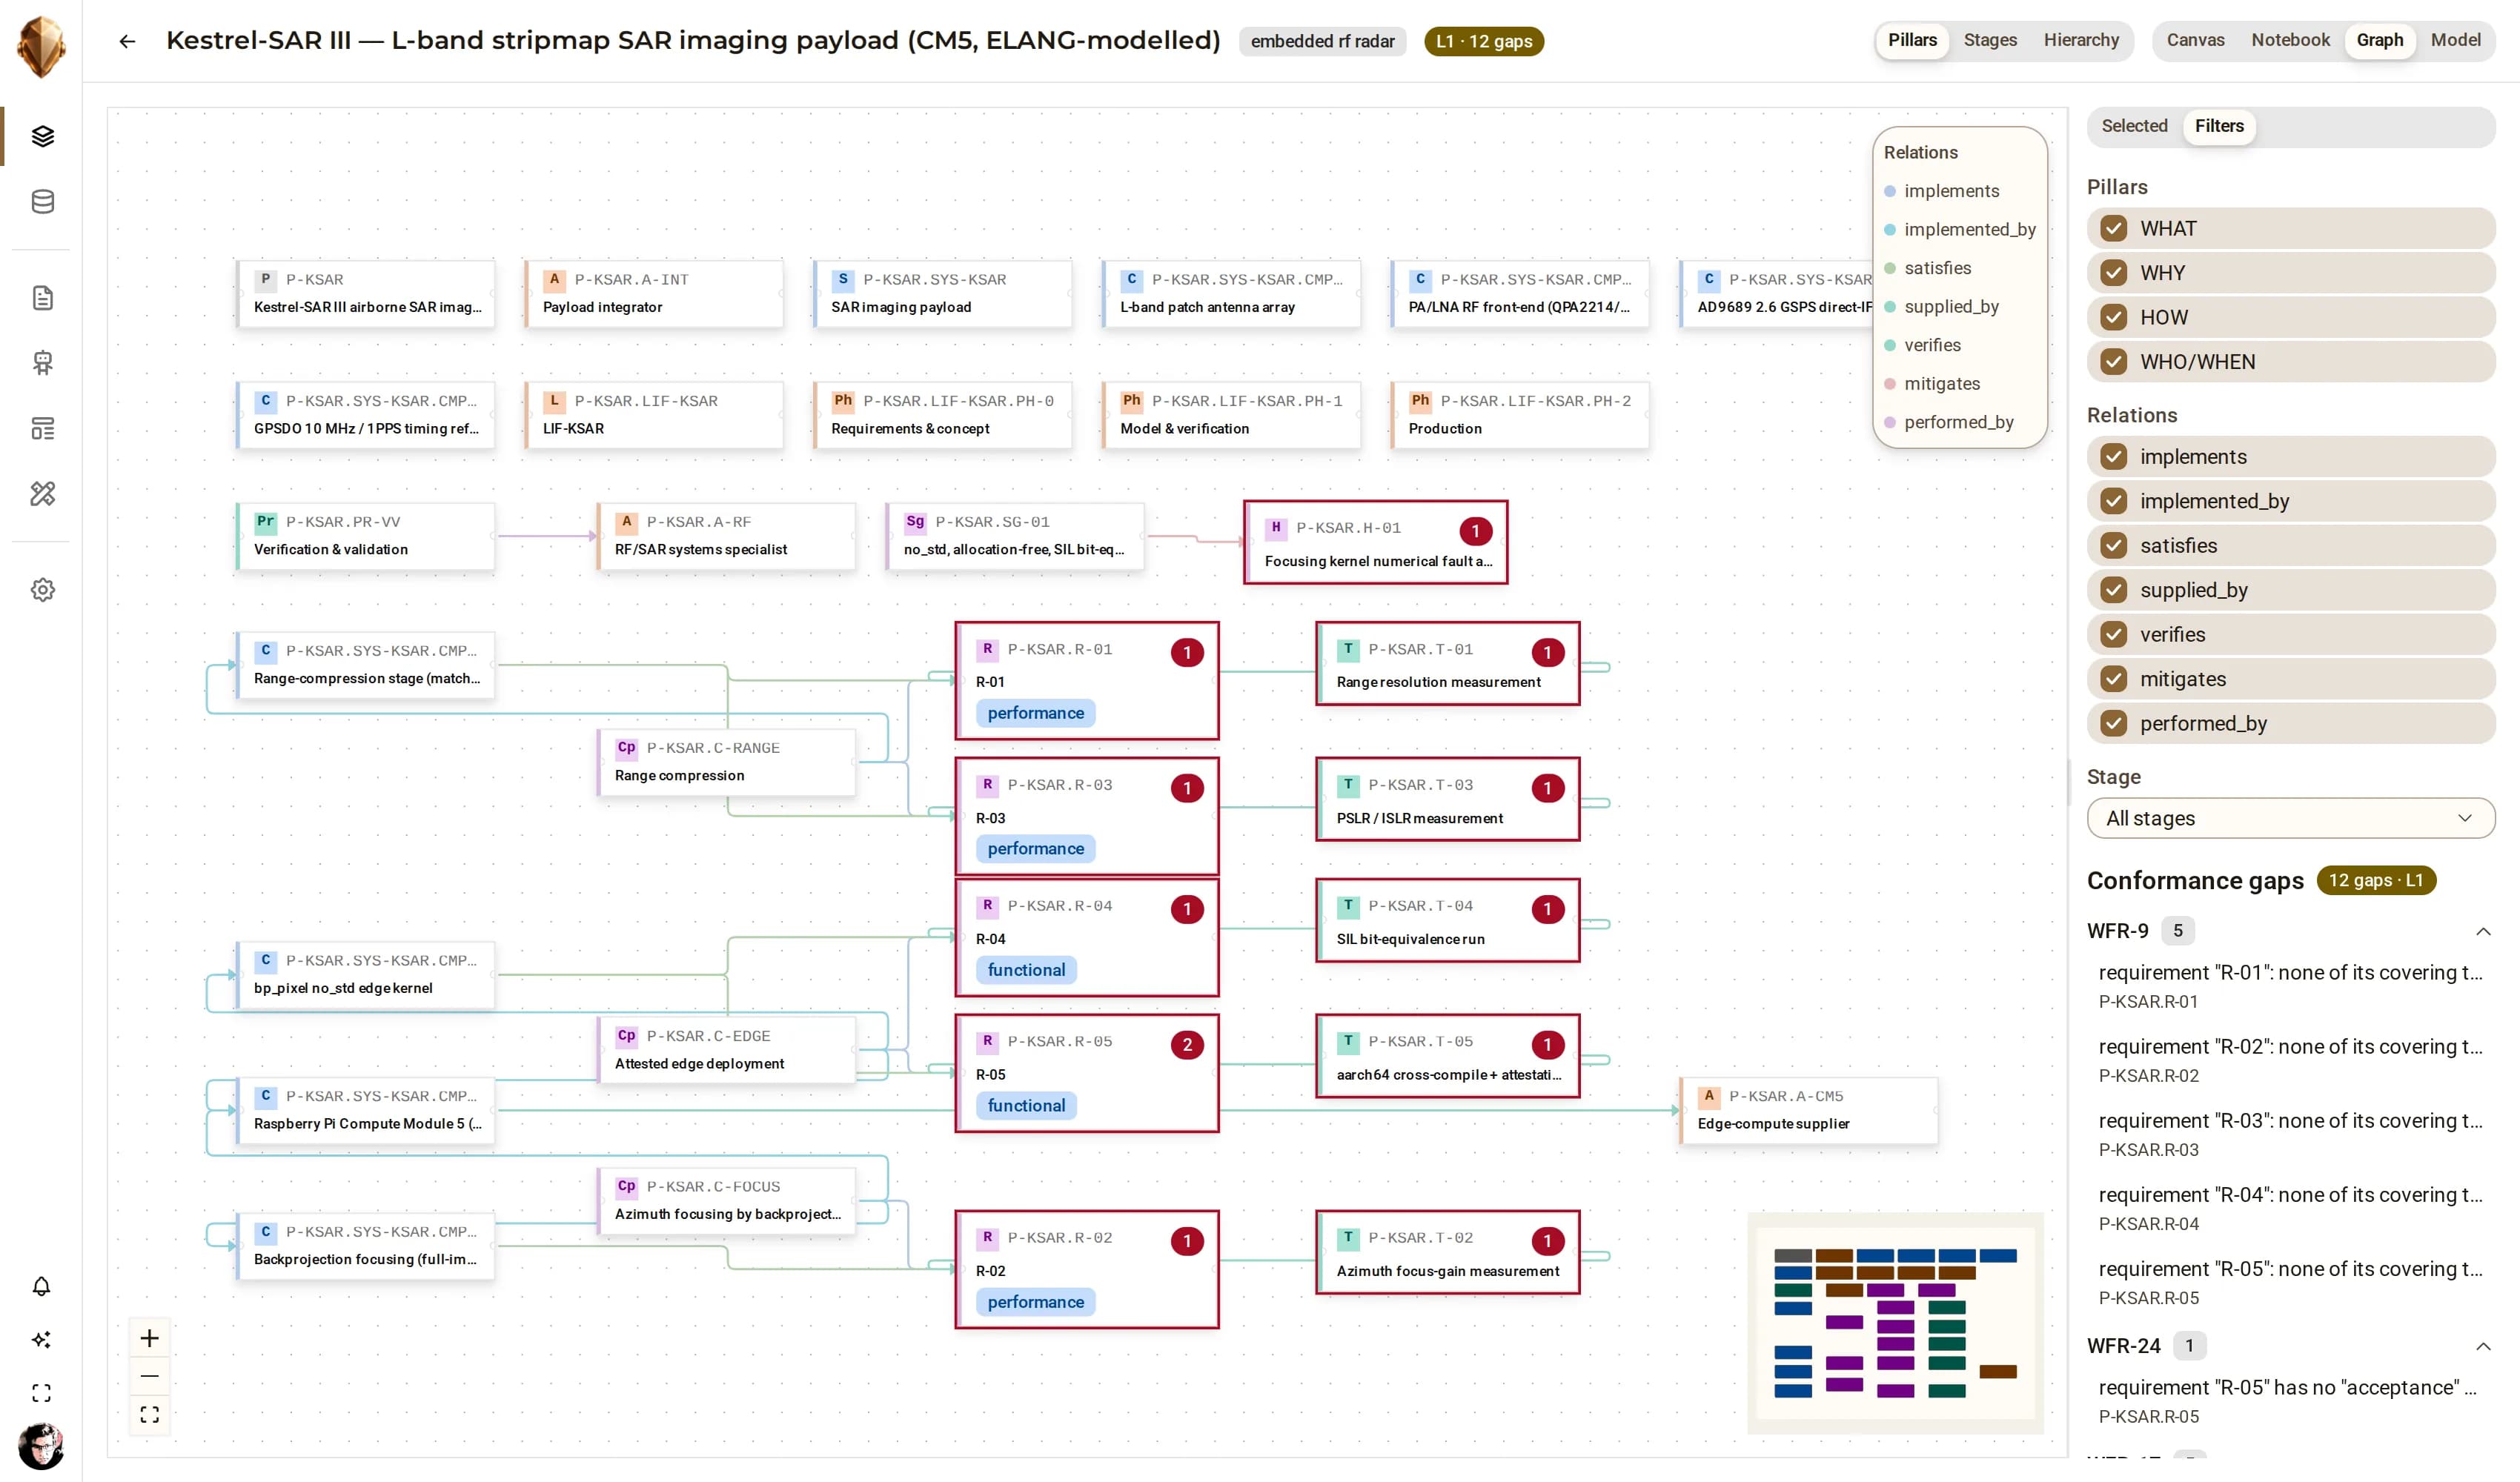 Grid-scale energySunnyGrid80 Solar-Storage PlantAn 80 MW photovoltaic plant with a 40 MW / 80 MWh battery energy-storage system and its grid substation, modelled in ELANG as an audited reference to UL 9540A and IEC 62443 — a system-of-systems where the interfaces carry as much of the design as the boxes.
 DjiniousEngineering
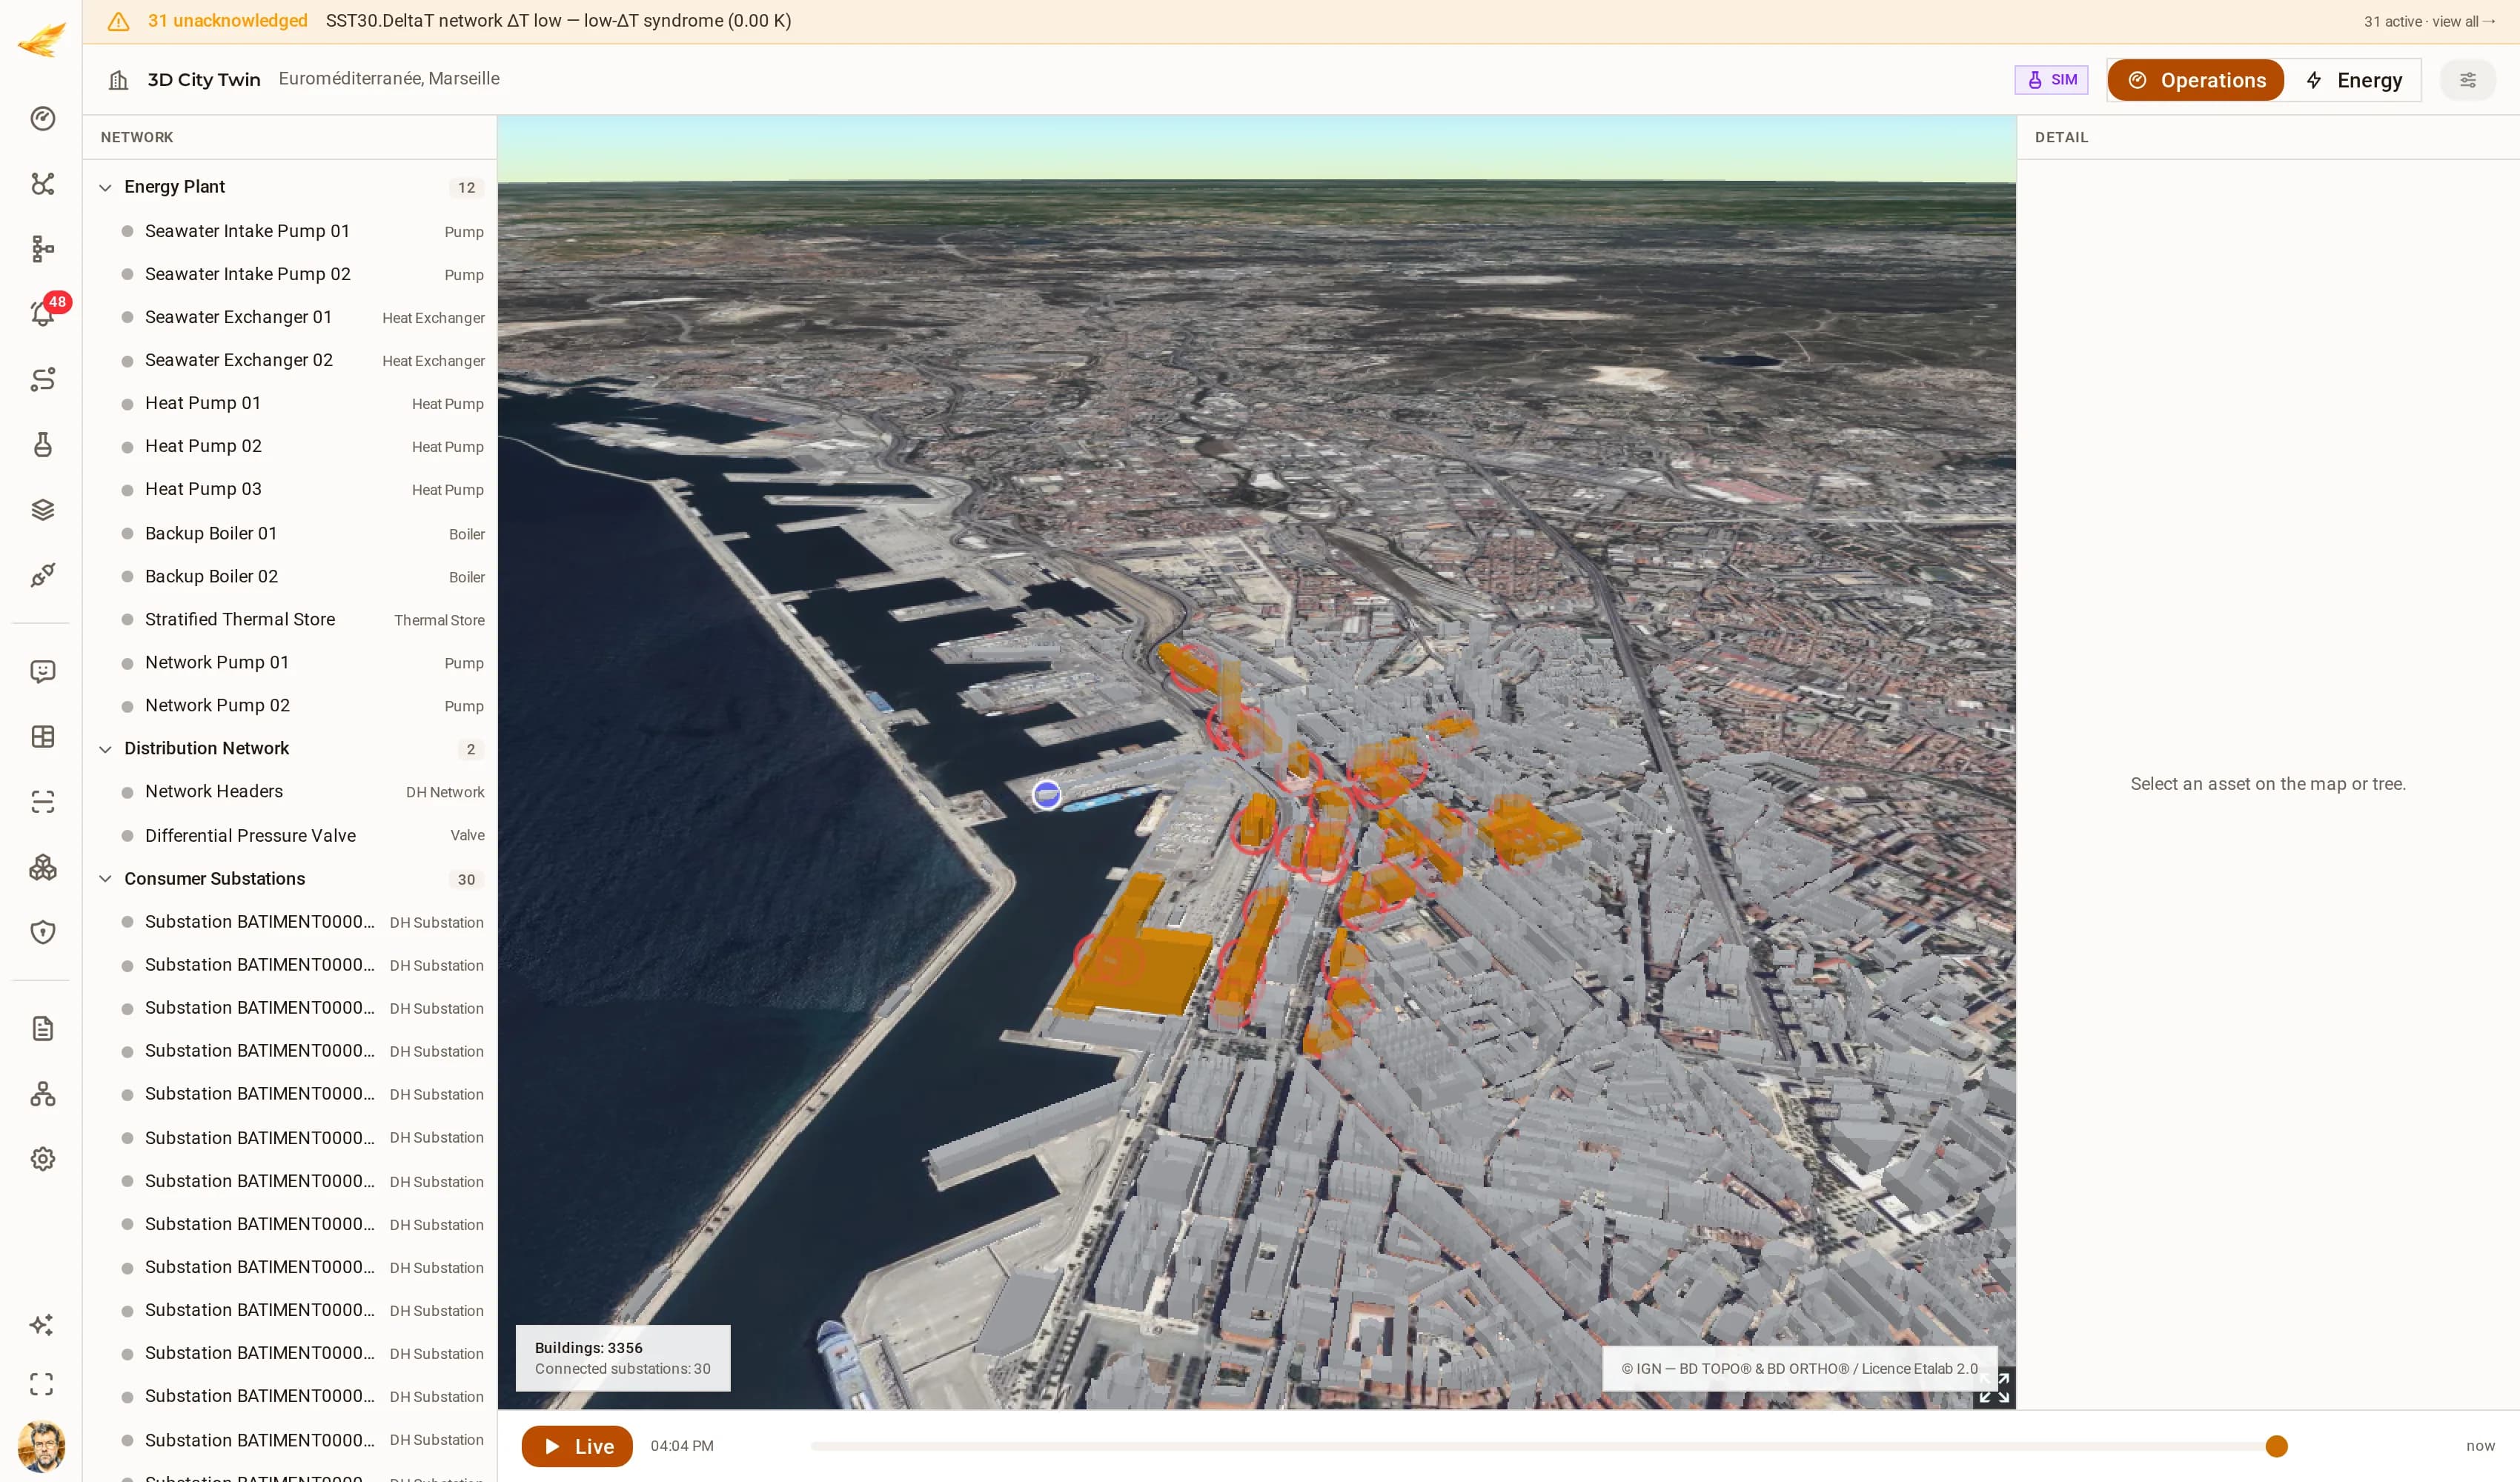 District energyEuroméditerranée District Energy NetworkA seawater-source district-heating network: two intake pumps and two seawater exchangers feeding three heat pumps, two backup boilers and a stratified thermal store, distributing through two network pumps and a differential-pressure valve to thirty consumer substations. The network is simulated; the city under it is not — every substation sits on its real IGN BD TOPO® building footprint in the Euroméditerranée quarter. It is a demonstration network on open data, not any operator's plant.
 DjiniousCC
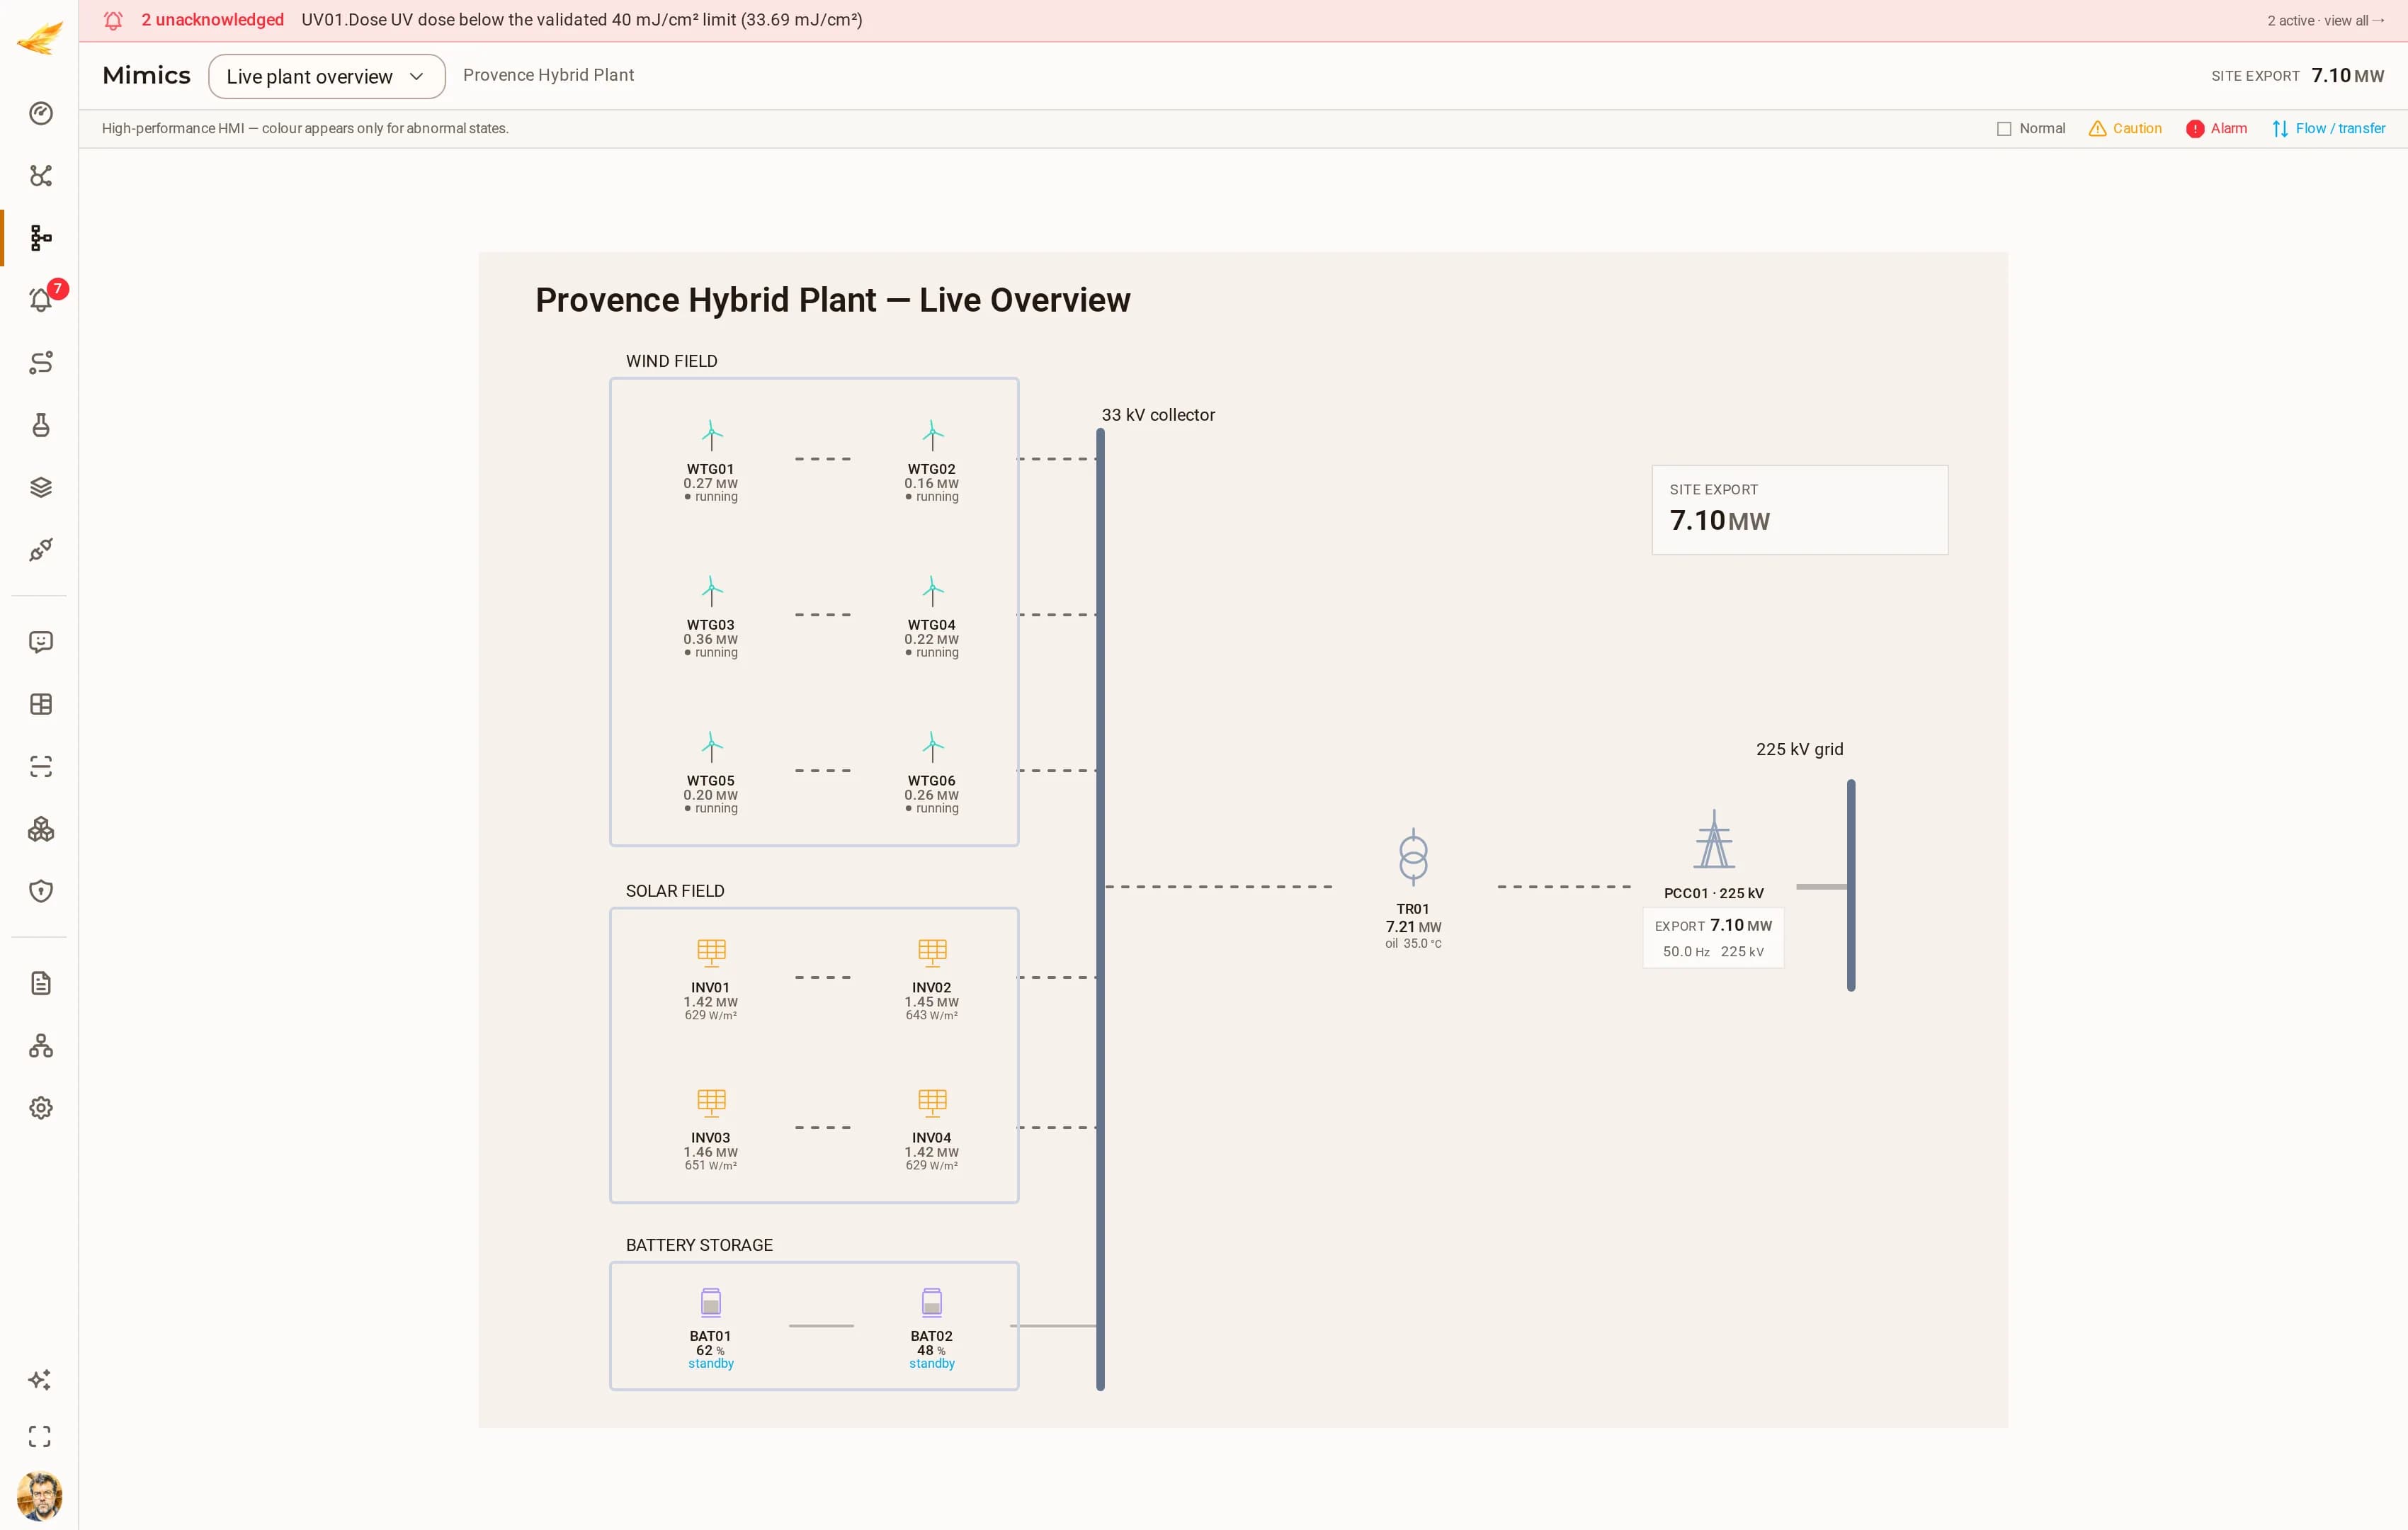 Renewable generationProvence Hybrid PlantA 120 MW hybrid plant: six wind turbines, four PV inverter blocks, two battery racks, the main 33/225 kV transformer, the grid connection point and a meteorological mast.DjiniousCC