 Djinious


Site reliability
Endpoints probed in parallel, incidents opened by the failure itself, and nothing reaching a public status page without a person approving the words.
 DjiniousWorkflow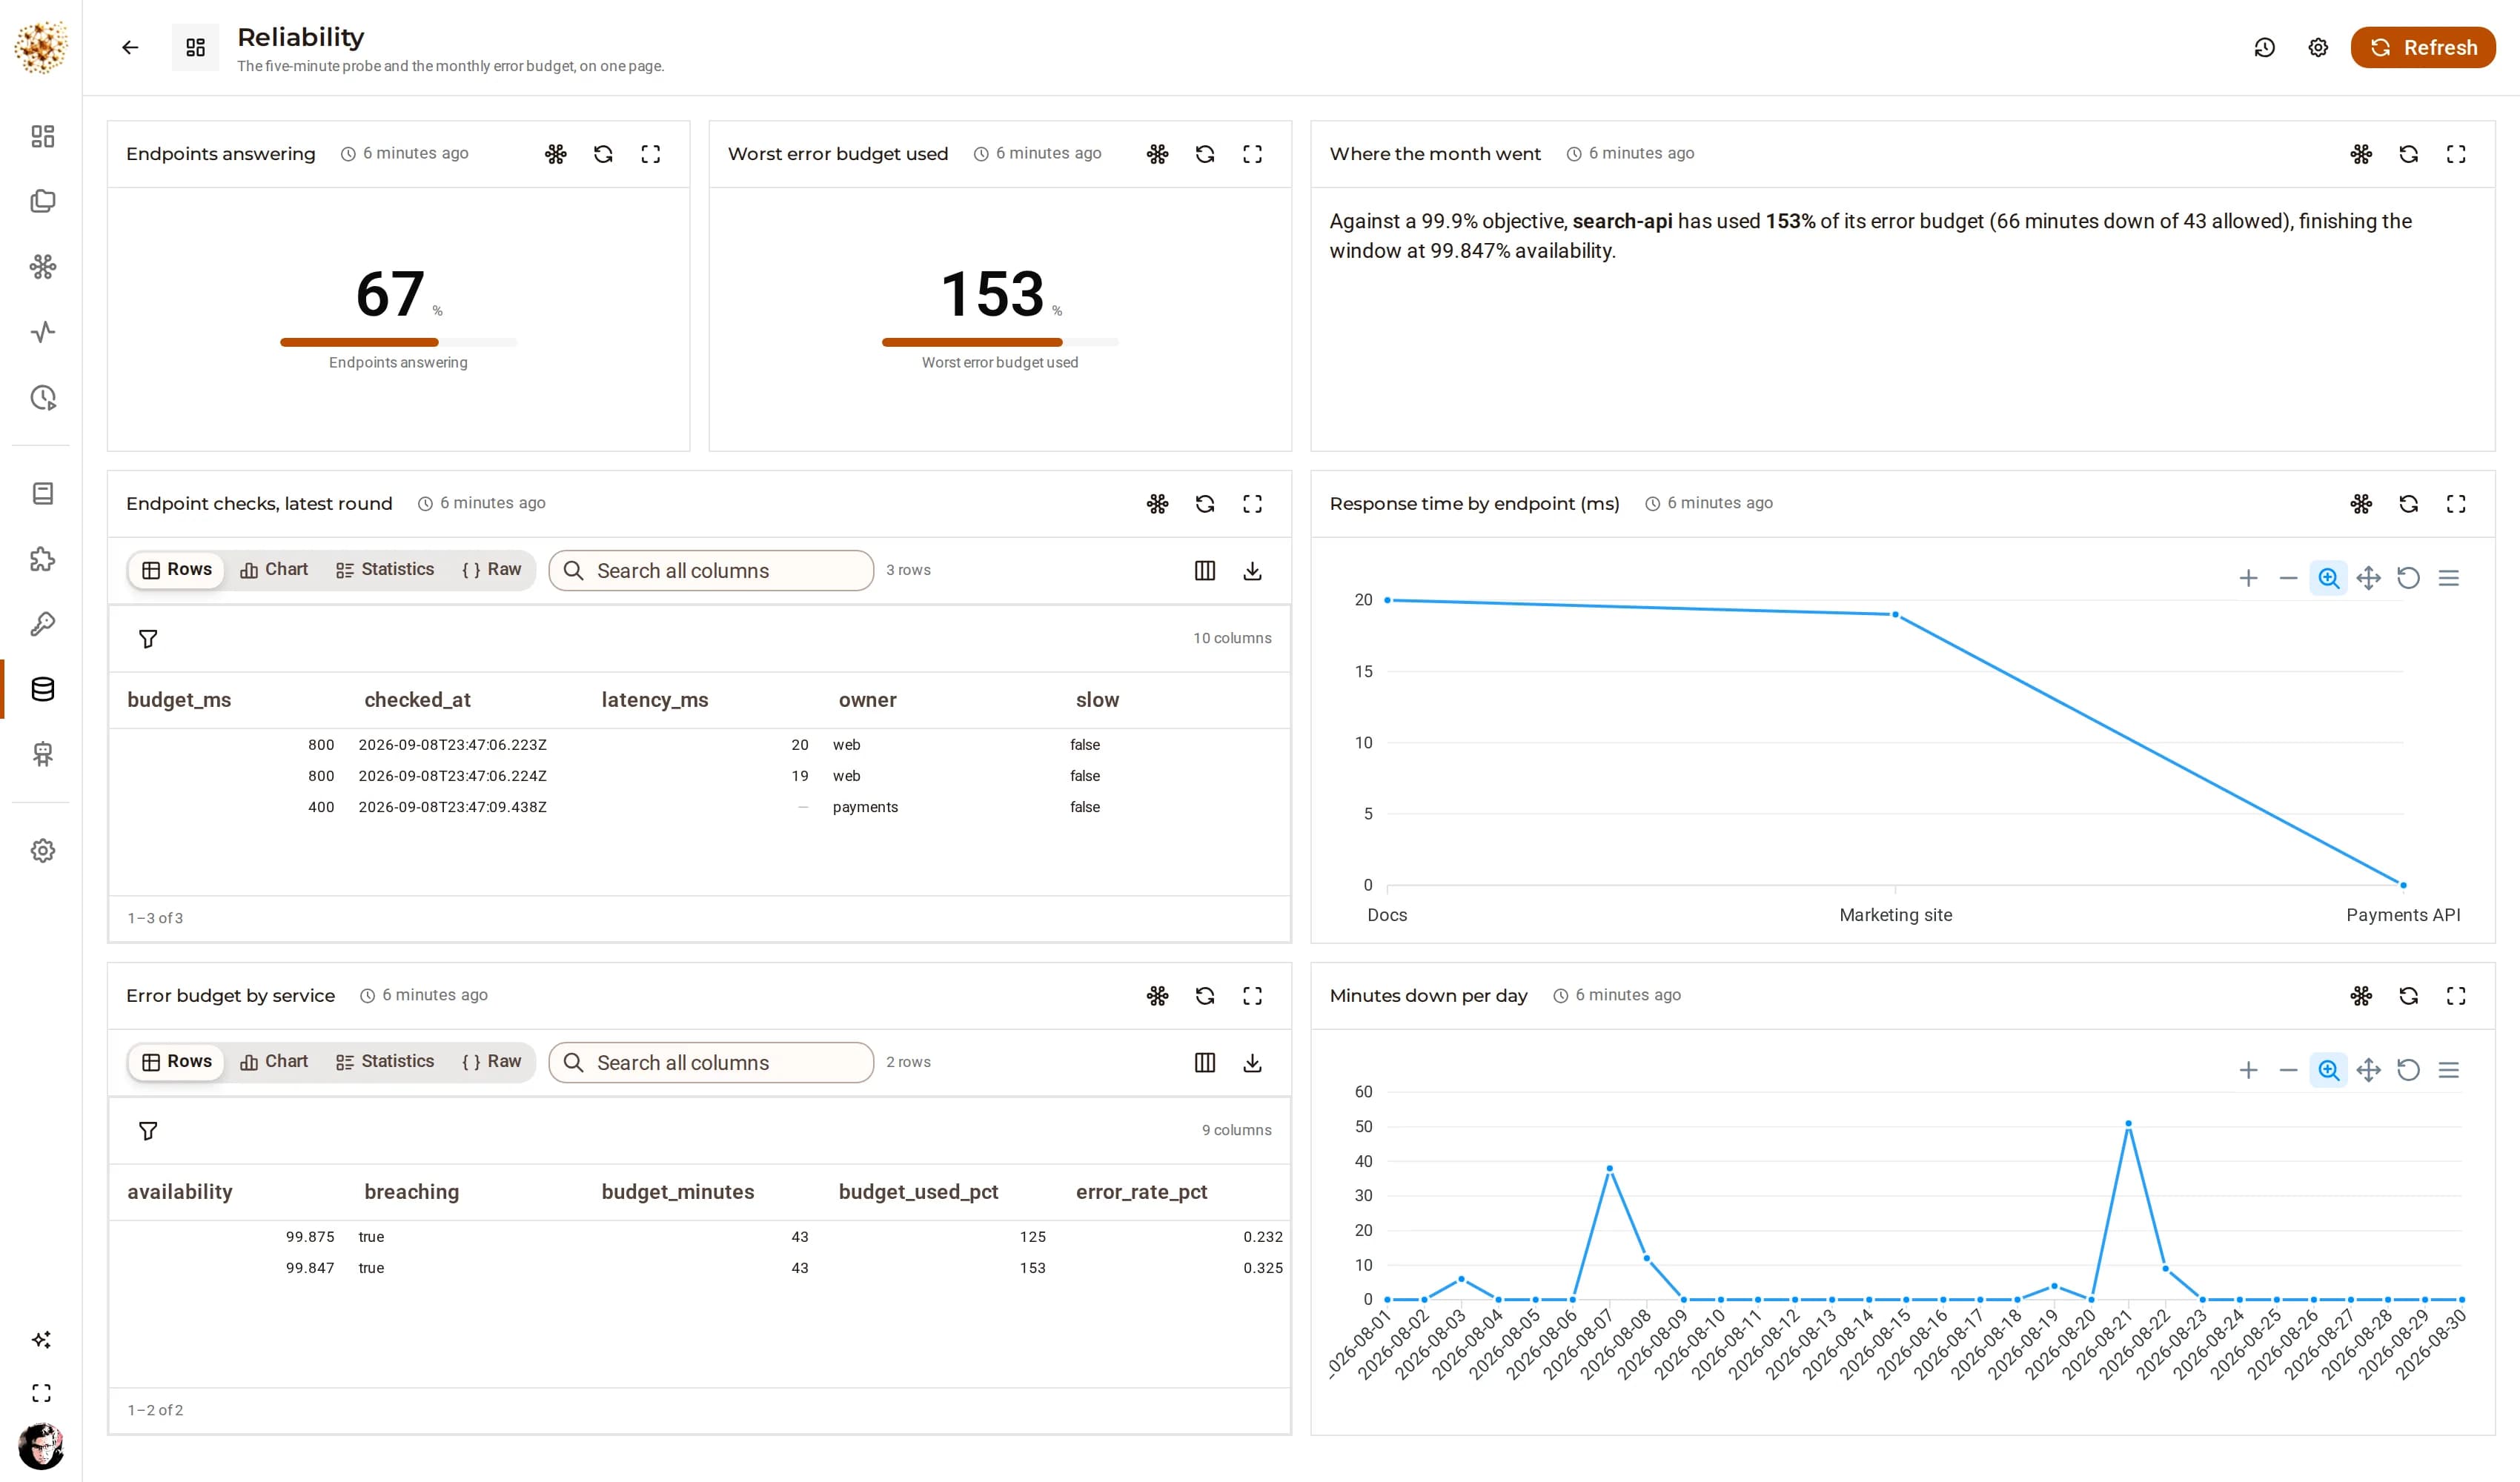
Retries · error branches · human gate
The probe graph deliberately watches an endpoint that does not resolve. It retries twice with backoff, leaves by the error branch, opens an incident record and pages the owning team — and the run still finishes green with the two healthy checks reported, because that is what the graph says should happen.
The intake graph routes an alert by severity, has a model draft the customer-facing sentence, and then stops: the approval is a database row, so the run waits for as long as the decision takes.
The probe, as it ran
DjiniousWorkflow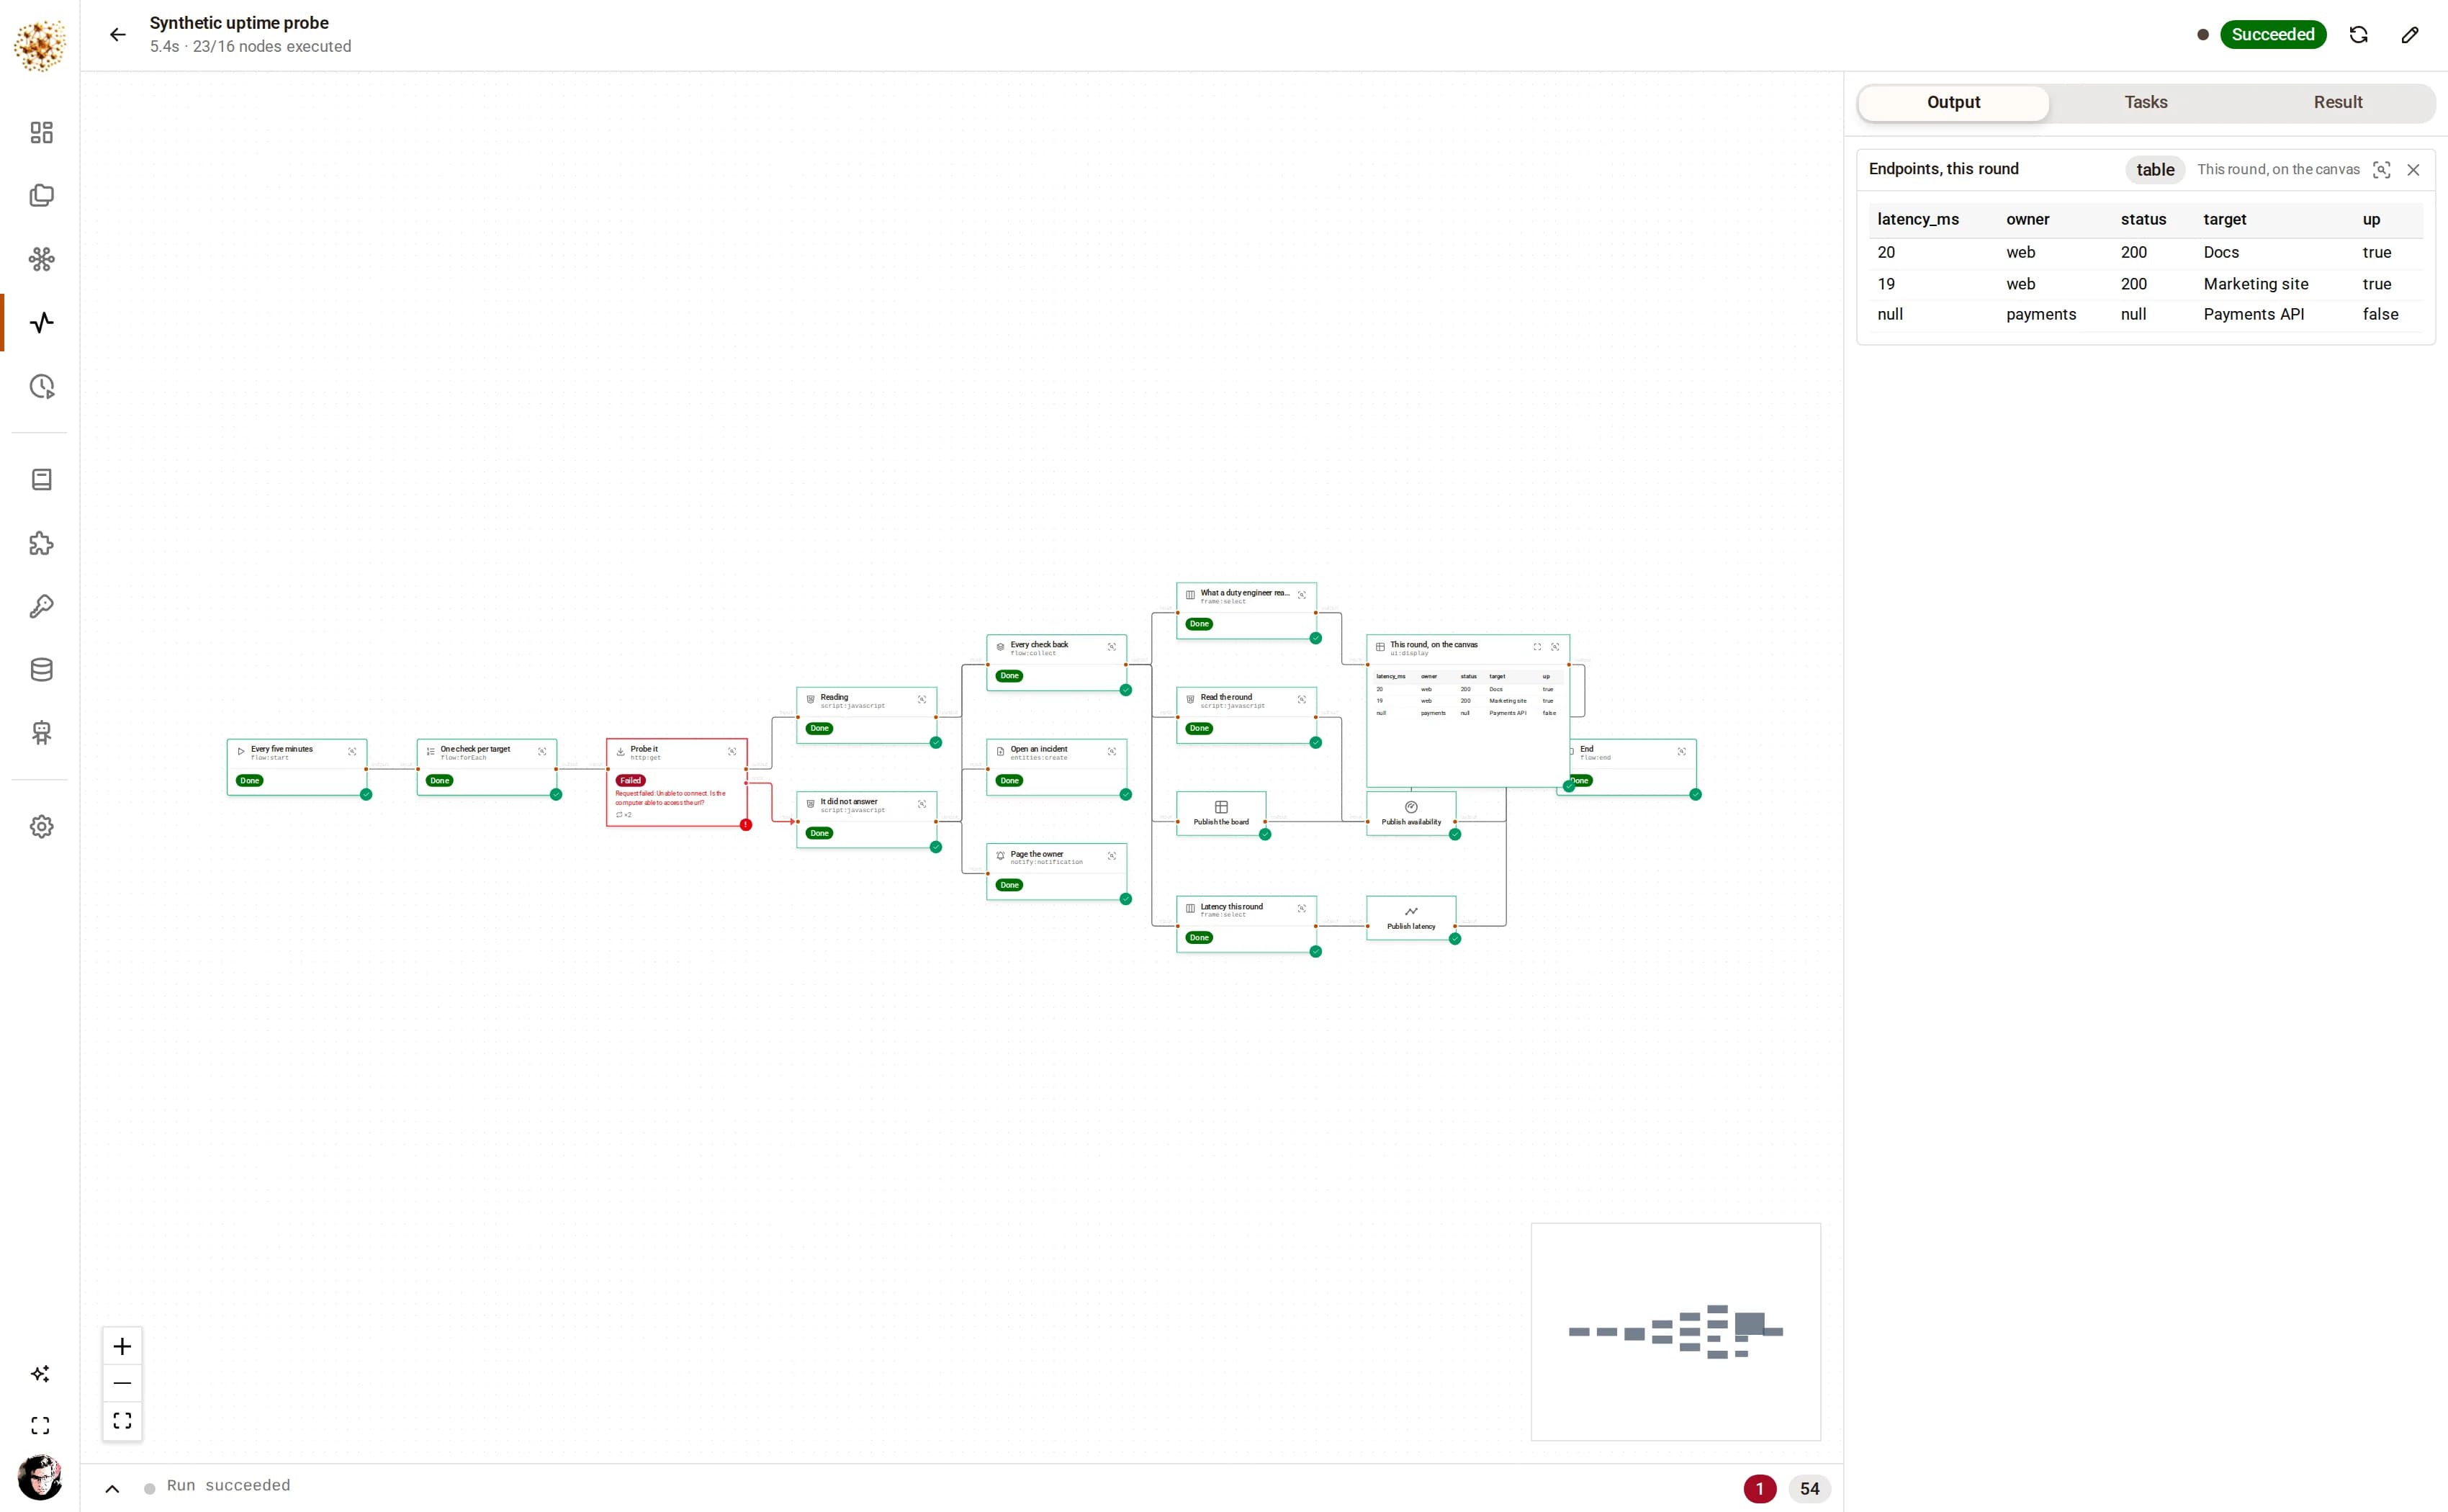
How the graphs run
One check per endpoint, fanned out
With retries and backoff on each.
A failure that becomes an incident
An incident record and a page, not a dead run.
Severity routing and a drafted status update
And a person between the draft and the public.
The month’s error budget
Read back out of a real database, with the SQL in the node.
On the canvas
http:get · __output_error · flow:approve · sql:sqlite* · views:metric
It ships with the product
This project ships with DjiniousWorkflow. One command seeds it, another runs every graph in it, and the captures here came out of those runs.
Where a graph leans on a fixture rather than a live system, it reads the fixture where your deployment would read a database — swap the node at the top and the rest of the graph does not change. The engine work — the fan-out, the gather, the approval, the publish — is the product’s own.
Keep exploring
Related use cases
 DjiniousDataMaster dataOne customer view from four systems that disagreeCluster the records that describe the same organization, and keep the ones you are not sure about out of the merge.DjiniousDataSite monitoringCounting what a camera sees, not what it detectsObject detection over photos, footage and live streams, materialised as metrics you can alert on.DjiniousData