 Djinious

Rotor aerodynamics
The power coefficient Cp(λ, pitch) and the full power curve — peak Cp ≈ 0.48 at a tip-speed ratio of 8.1, 81% of the Betz limit, across cut-in, rated and cut-out.
The platform
Each application does one part of the work — and hands its evidence to the next. Use them together, or one at a time.
Platform overviewSee how the loop runs DjiniousEngineeringOrchestration
 DjiniousLabModelling & simulation
 DjiniousWorkshopSystem integration
 DjiniousSafeCertifiable code
 DjiniousWorld3D replicas
 DjiniousMapAgent GIS
 DjiniousCCOperations & SCADA
 DjiniousDataKnowledge base
 DjiniousWorkflowAgent automation
A multi-megawatt wind turbine and its farm — rotor aerodynamics, a two-inertia drivetrain, MPPT torque and pitch control, turbulent-load analysis, and a wake-optimised farm layout that lifts annual energy 18%.
 DjiniousLab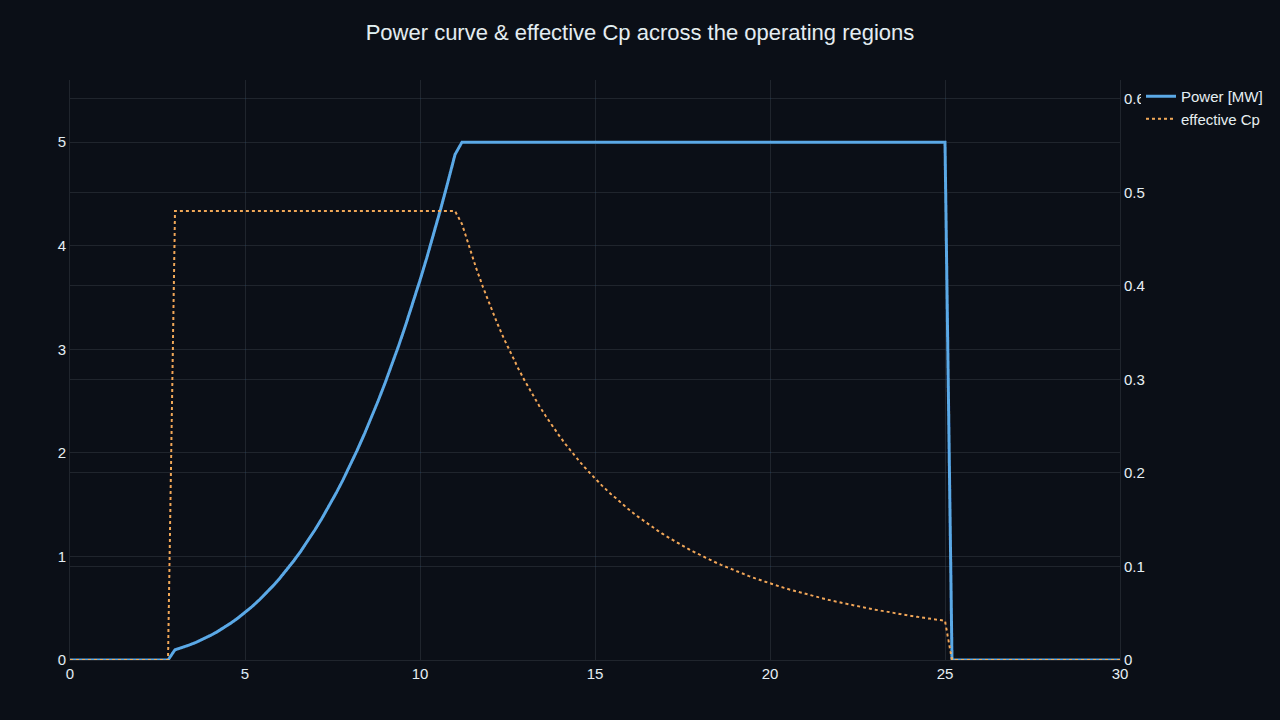
A multi-megawatt turbine modelled where aerodynamics, drivetrain dynamics and control meet — the Cp(λ) surface, a two-inertia drivetrain, region-2 MPPT and region-3 pitch control, and turbulent loads — then scaled out to a farm where wake interaction is optimised away for 18% more annual energy. The drivetrain also lives as a runnable acausal .djl over a custom rotational domain.
Each subsystem is its own runnable notebook, building from a single rotor's coefficient curve up to a wake-coupled farm layout.
The power coefficient Cp(λ, pitch) and the full power curve — peak Cp ≈ 0.48 at a tip-speed ratio of 8.1, 81% of the Betz limit, across cut-in, rated and cut-out.
A two-inertia drivetrain — rotor, a compliant low-speed shaft, gearbox and generator — spins up under a K-ω² law to 12.3 rpm and re-settles cleanly after a wind step.
A wind-sensorless K-ω² torque law holds the tip-speed ratio around its optimum through varying wind, capturing near-ideal power in region 2.
A PI pitch loop feathers the blades in region 3 to hold rated power through a +5 m/s gust with only 0.4% overspeed.
A Dryden-like turbulent wind field (TI ≈ 0.14) drives the rotor to a ~736 kN thrust load, with a low-frequency-dominated load spectrum from the FFT.
A Jensen wake model with a CMA-ES layout optimiser lifts wind-rose annual energy 18% over a naive 4×4 grid — the optimised 16-turbine farm on a map.
DjiniousLabDjiniousLab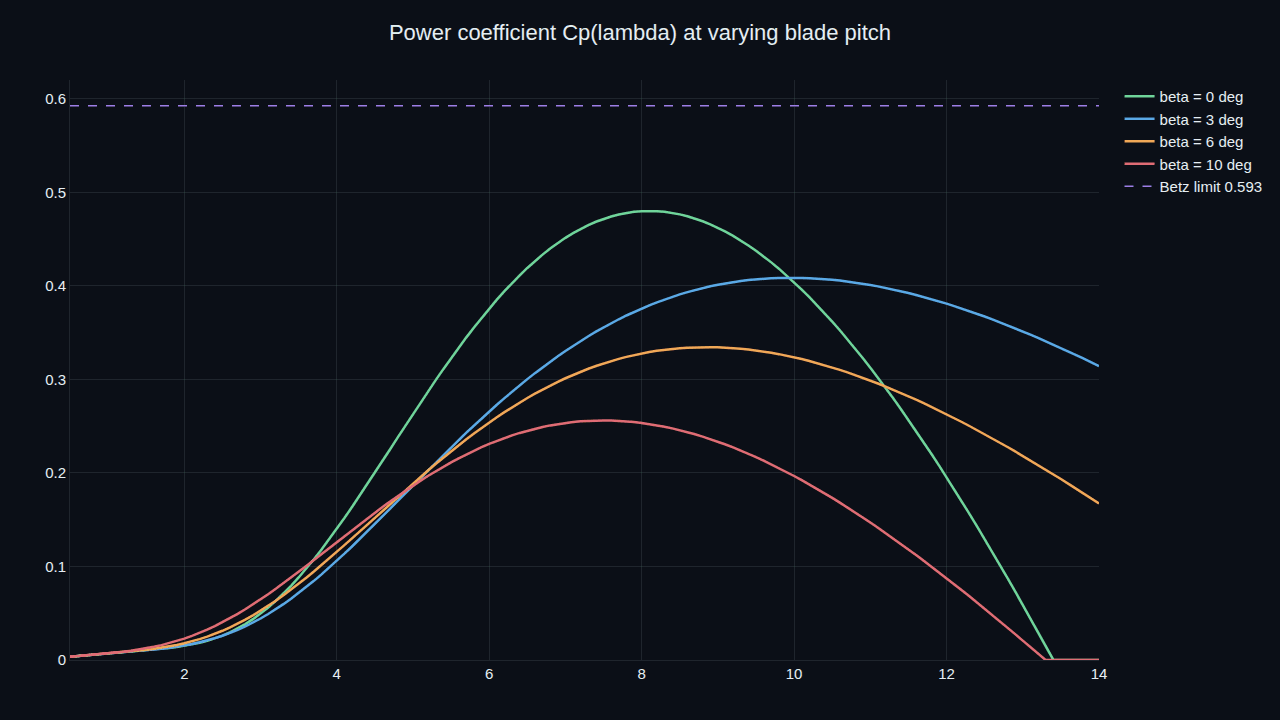
The two-inertia drivetrain is a runnable acausal .djl — aerodynamic torque into a rotor inertia, through a compliant shaft and a step-up gearbox, into the generator's torque-control brake. It is built on a custom rotational domain (angle as the potential, torque as the flow) that doesn't ship in the block catalog — defined inline in a few lines and solved by the same kernel that handles electrical and mechanical networks, with no engine changes. It spins up from 1.0 to 1.49 rad/s to its region-2 torque balance, about 6 MW. The same acausal kernel models fluid power, rotational mechanics, or any domain you can write a connector for.
DjiniousLab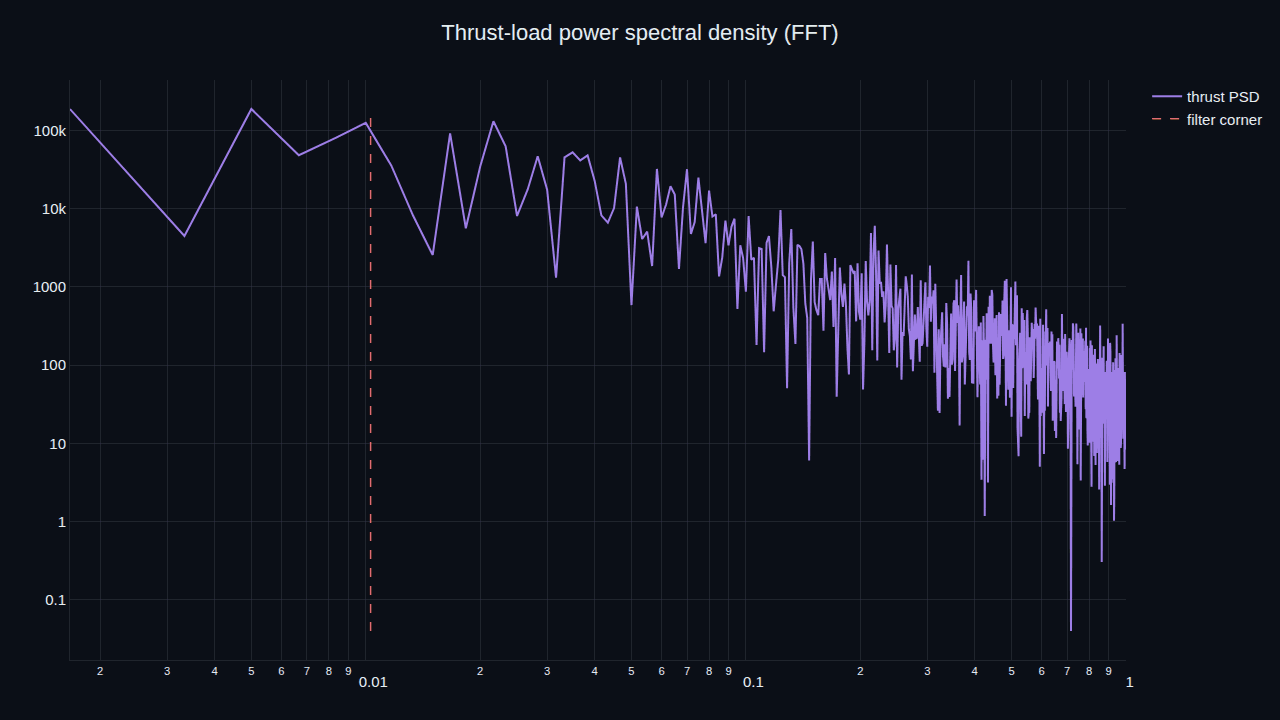
The notebooks are gated on worker-verified results, and the drivetrain .djl is confirmed solving through the production canvas engine.
Aerodynamics is a Cp(λ, pitch) coefficient model, not a blade-element-momentum or CFD rotor; the drivetrain is a lumped two-inertia model; the wake is the analytic Jensen model, not a high-fidelity wake simulation. Turbulence is a Dryden-like spectral field. That is the fidelity wind-farm design needs first: sizing the rotor and drivetrain, tuning the torque and pitch controllers, bounding turbulent loads, and laying out the array so wakes cost the least energy — on your own site wind rose, before a CFD campaign or an aeroelastic model.
Keep exploring
 Grid-scale energySunnyGrid80 Solar-Storage PlantAn 80 MW photovoltaic plant with a 40 MW / 80 MWh battery energy-storage system and its grid substation, modelled in ELANG as an audited reference to UL 9540A and IEC 62443 — a system-of-systems where the interfaces carry as much of the design as the boxes.
 DjiniousEngineering
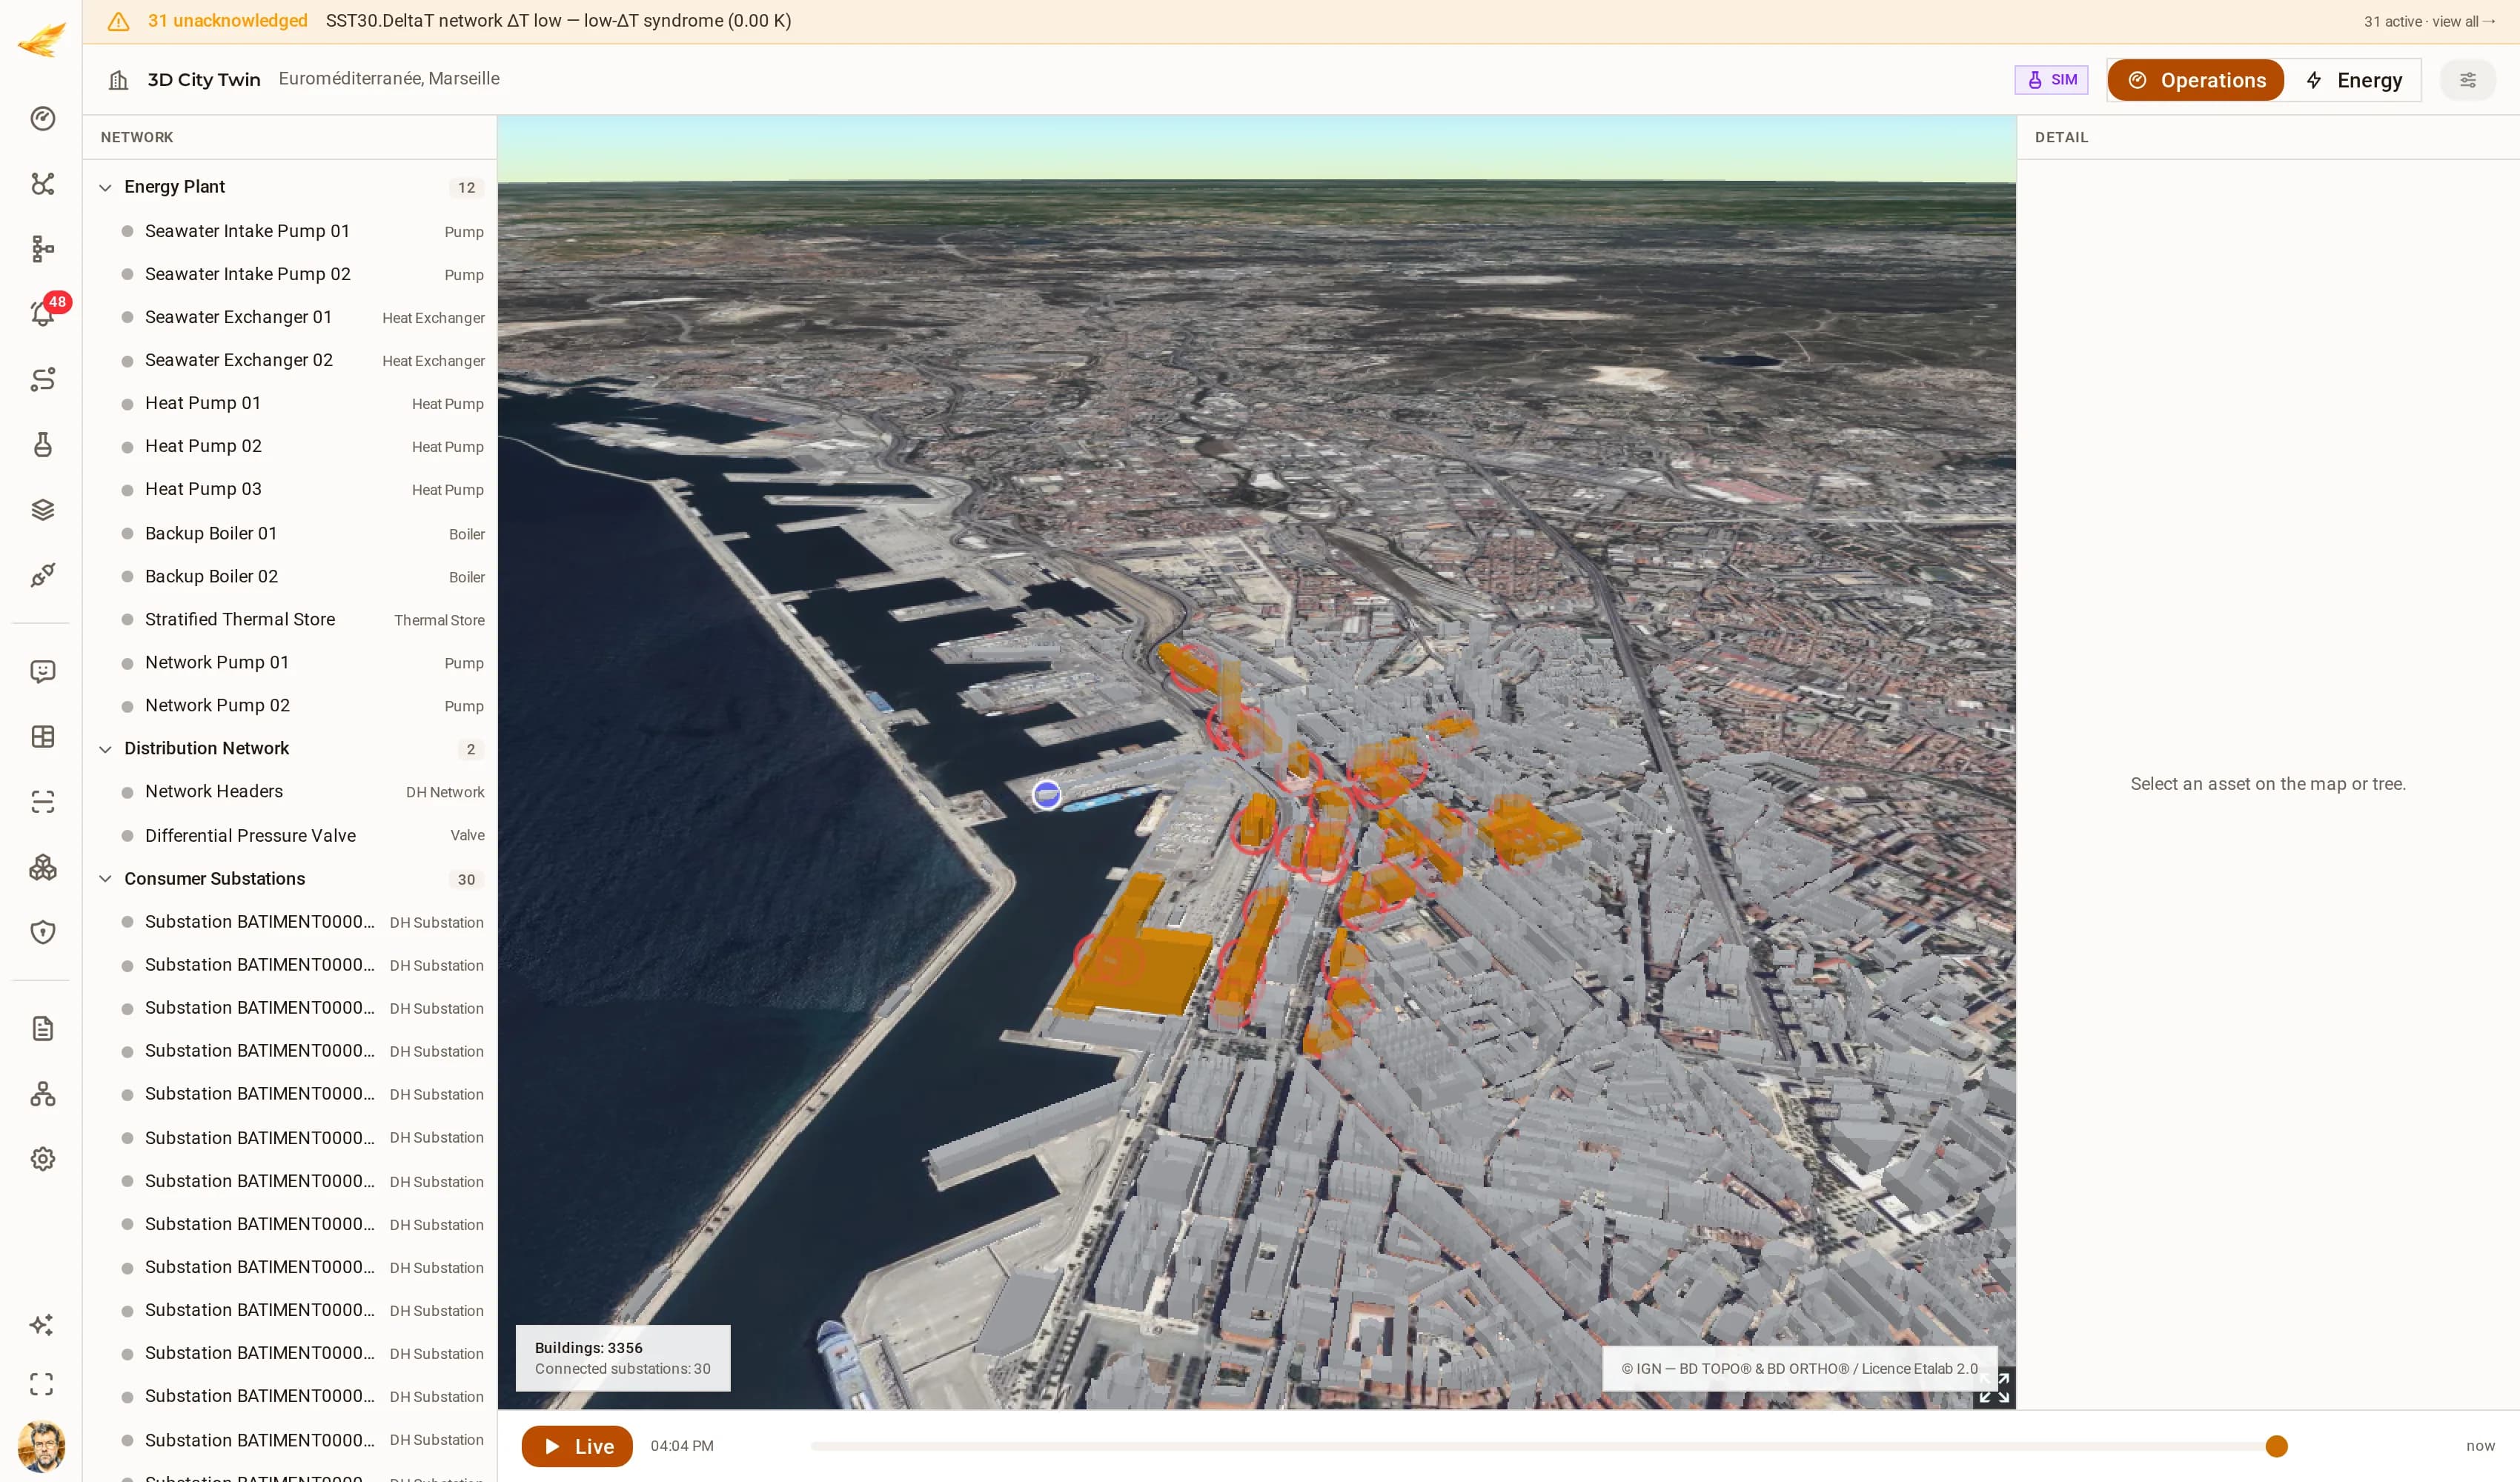 District energyEuroméditerranée District Energy NetworkA seawater-source district-heating network: two intake pumps and two seawater exchangers feeding three heat pumps, two backup boilers and a stratified thermal store, distributing through two network pumps and a differential-pressure valve to thirty consumer substations. The network is simulated; the city under it is not — every substation sits on its real IGN BD TOPO® building footprint in the Euroméditerranée quarter. It is a demonstration network on open data, not any operator's plant.
 DjiniousCC
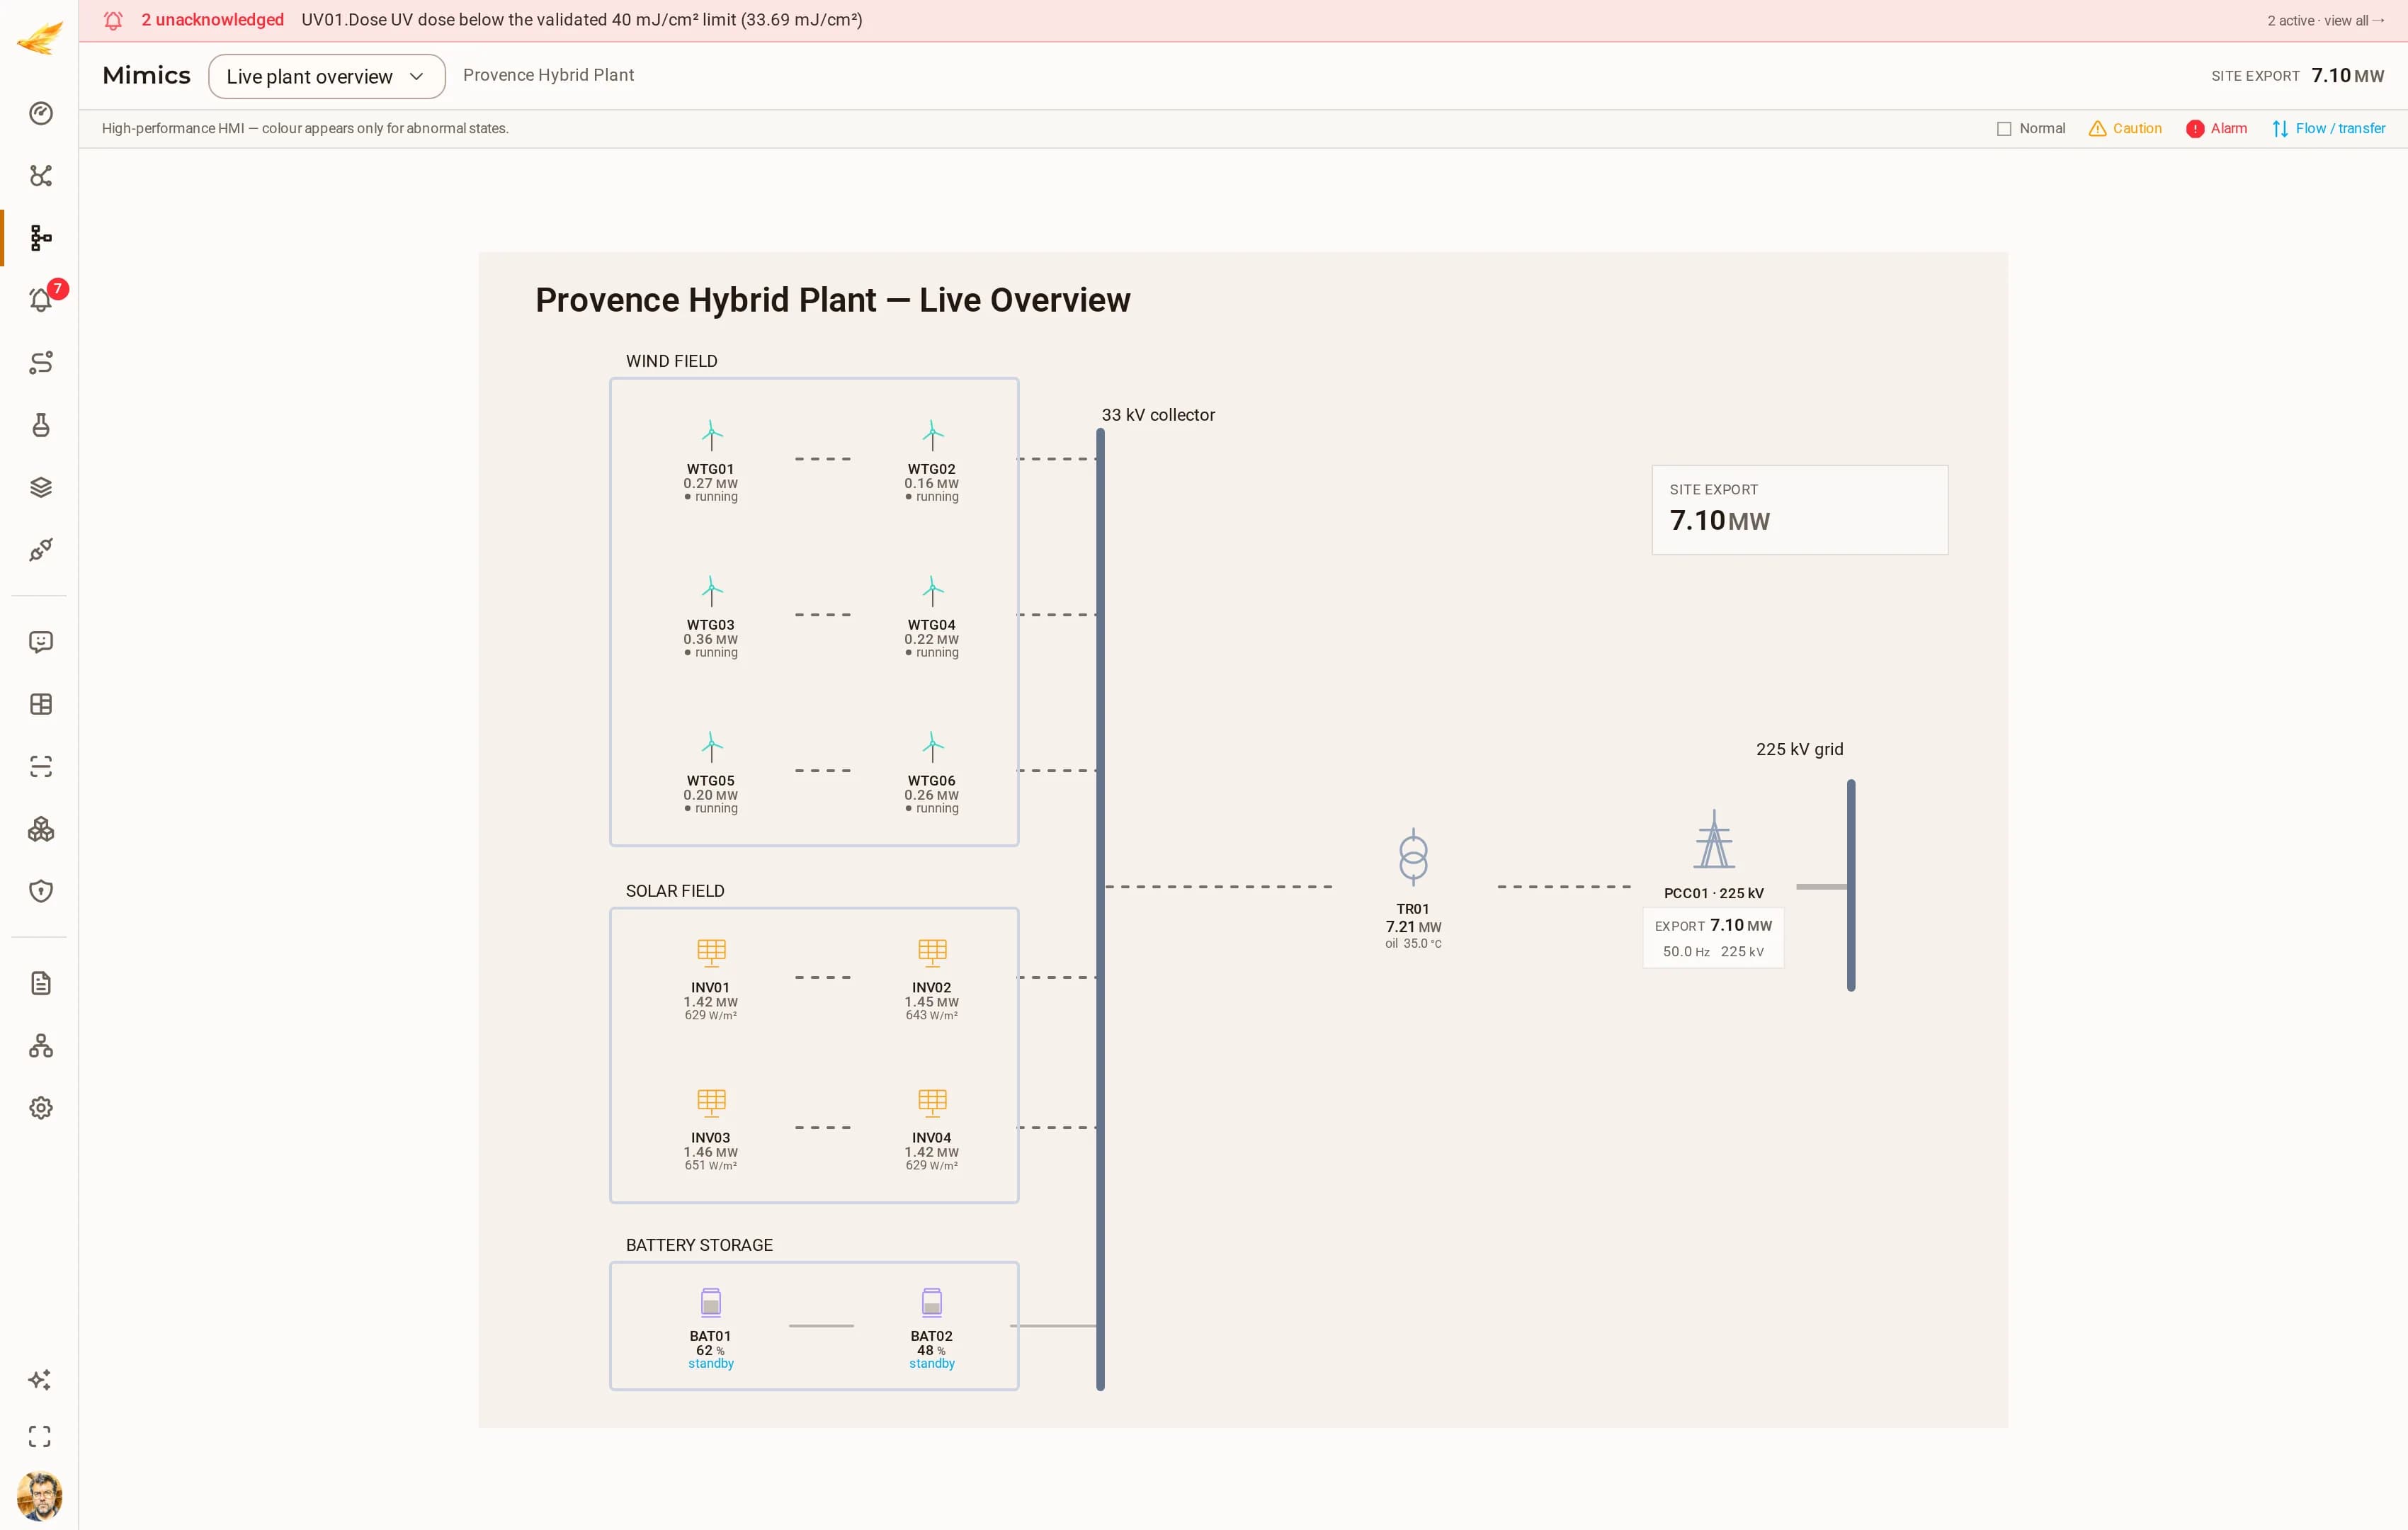 Renewable generationProvence Hybrid PlantA 120 MW hybrid plant: six wind turbines, four PV inverter blocks, two battery racks, the main 33/225 kV transformer, the grid connection point and a meteorological mast.DjiniousCC