 Djinious


Full EV vehicle
The battery pack you sized becomes the car you drive — a complete electric vehicle over the WLTP cycle: drive cycle, traction motor, regen, the battery over the cycle, thermal, and the numbers that sell a car — range, consumption, and 0–100.
 DjiniousLab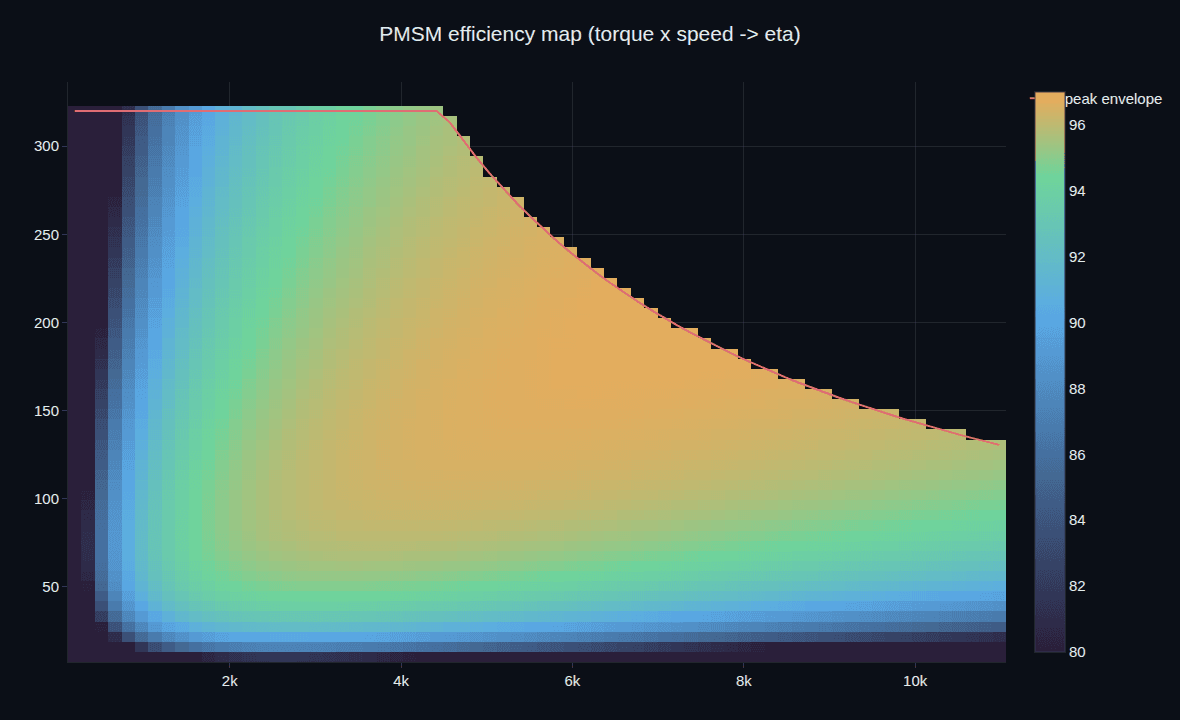
- WLTP range (60 kWh)
- 374 kmWLTP range (60 kWh)
- kWh/100km consumption
- 15.2kWh/100km consumption
- 0–100 km/h
- 6.67 s0–100 km/h
- energy from regen
- 10.7%energy from regen
- pack rise over WLTP
- 7.0 Kpack rise over WLTP
- design notebooks
- 10design notebooks
From battery pack to the car you drive.
The EV battery program sized the pack. This one drives it. A complete electric vehicle — traction motor, single-speed driveline, regenerative braking, vehicle dynamics, and the pack from the battery program — run over the WLTP drive cycle, on one coupled electro-mechanical-thermal model. Out come the numbers a buyer and an engineer both care about: range, consumption, acceleration, and how hot the pack gets doing it.
One coupled chain, the cycle as input.
The WLTP speed trace is the input, and the model runs backward through the drivetrain: speed and acceleration set the tractive force (aerodynamic, rolling, inertia), the wheels demand power through the motor's efficiency map, the driveline and regen split it, and that lands on the battery as a constant-power load. The pack — the same equivalent-circuit cell from the battery program — sags on acceleration, recovers on regen, depletes its state of charge, and heats up, all from one set of coupled equations. The battery you sized at the cell level is now answering vehicle-level questions.
DjiniousLabDjiniousLab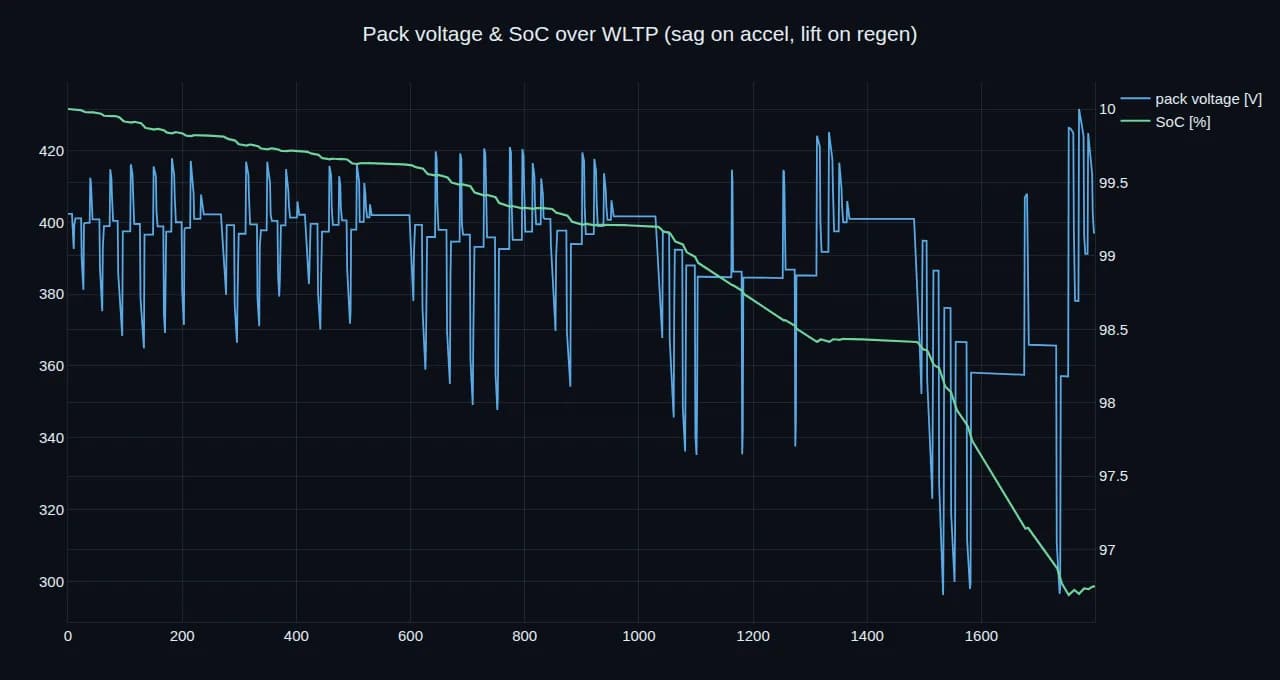
Range is an accounting problem.
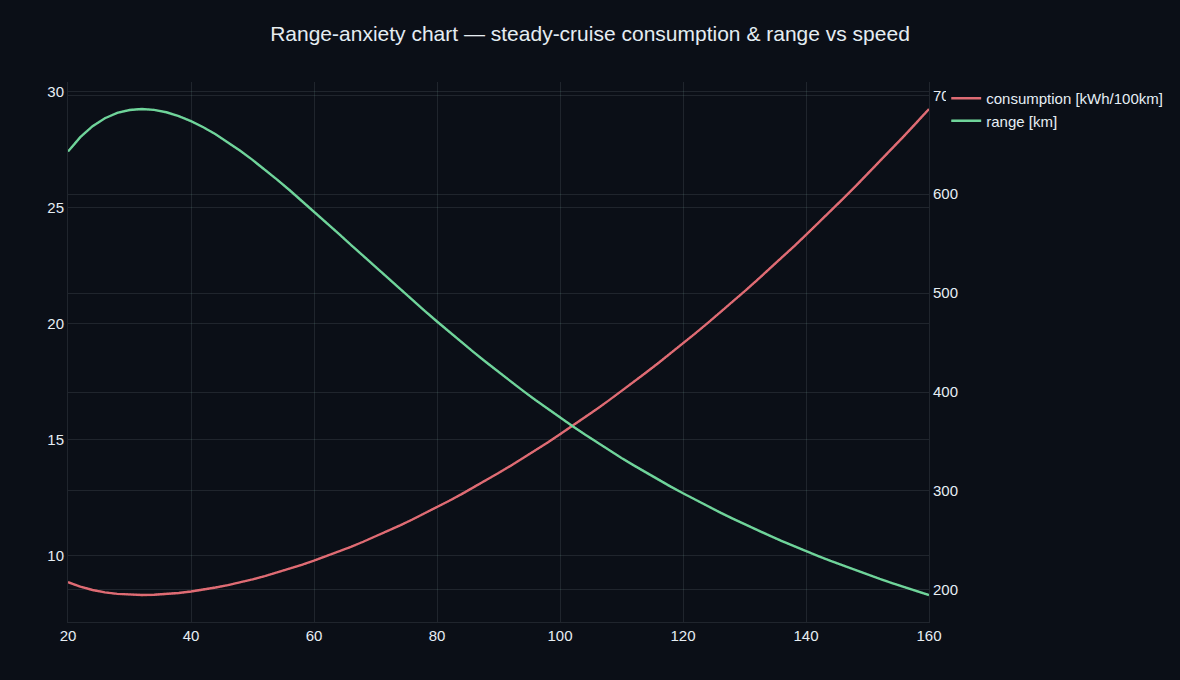
Consumption is just energy in minus energy recovered, divided by distance. The model breaks the WLTP energy into where it actually goes — aerodynamic drag, rolling resistance, powertrain losses, accessories — and how much regen claws back (10.7% over the cycle, 52% of the braking kinetic energy). That ledger gives 15.2 kWh/100km and a 374 km range, and it shows exactly which term to attack: at 130 km/h cruise, aerodynamic drag dominates and consumption climbs to 21.4 kWh/100km — the range-anxiety curve, quantified.
DjiniousLab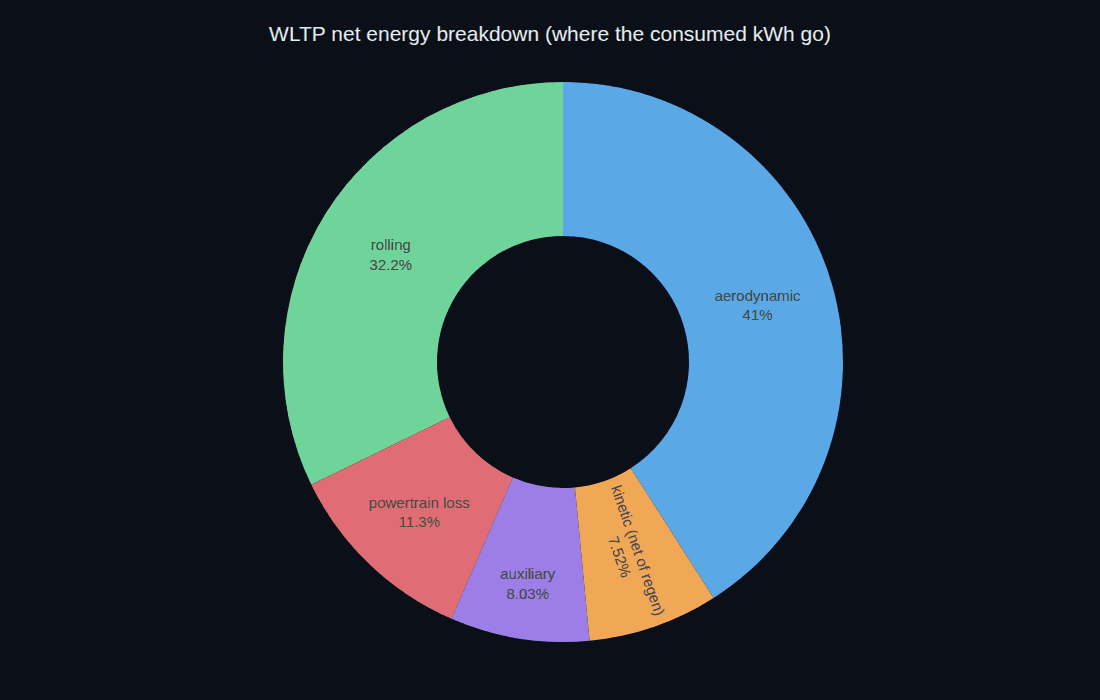 DjiniousLab
 DjiniousLab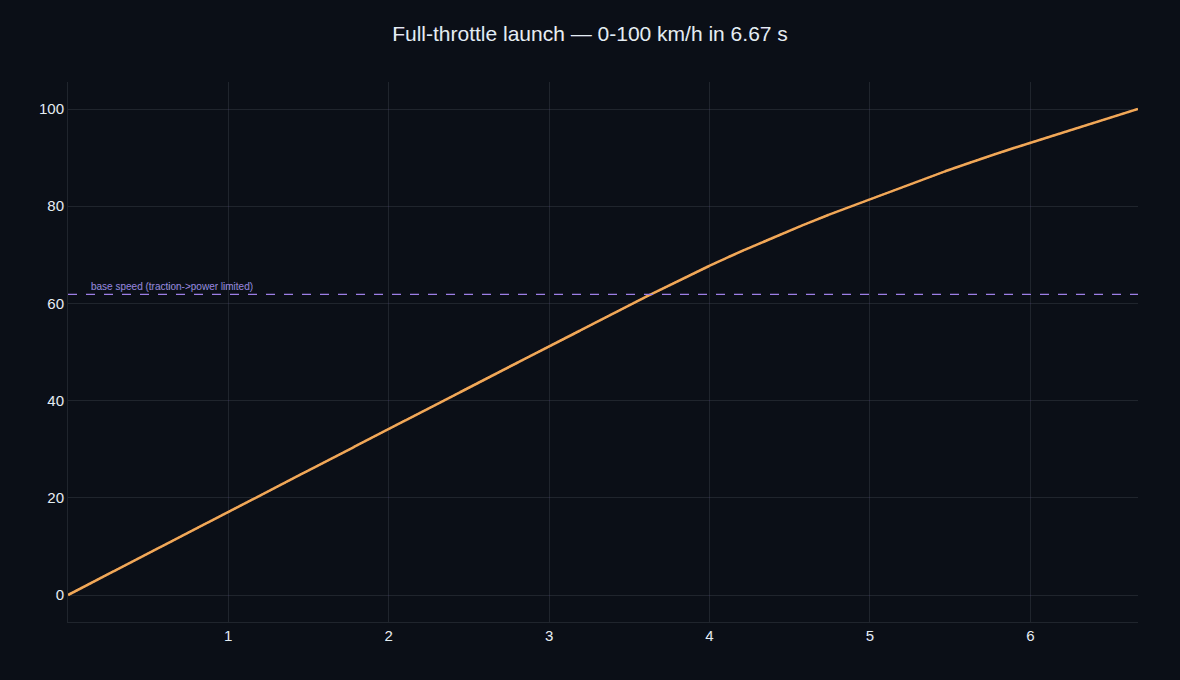
Every spec is a number you can re-run.
The sign-off notebook re-derives each requirement from first principles over the same cycle the program drives.
Result
- WLTP range: 374 km
- WLTP consumption: 15.2 kWh/100km
- 0–100 km/h: 6.67 s
- Pack temperature rise: 7.0 K
- Requirements verified: 6 / 6
Requirement
- WLTP range: ≥ 350 km
- WLTP consumption: within target
- 0–100 km/h: within target
- Pack temperature rise: within limit
- Requirements verified: PASS
Backward-facing, design-grade.
The model is backward-facing and quasi-static — the cycle is the input, not the output of a driver chasing it — which is the industry-standard way to get range and consumption, and it avoids a controller and stiffness for no fidelity gain. The motor is an efficiency map rather than a field-oriented-control PDE, the battery is the equivalent-circuit surrogate from the pack program, the thermal model is lumped, and the WLTP profile is a faithful approximation (the official second-by-second trace is proprietary). It is exactly the fidelity vehicle concept and sizing needs first — battery and motor sizing, range and consumption, the regen and thermal budget — on your own numbers, before a full dynamic co-simulation. And because the pack is shared, the cell-level work and the vehicle-level work never drift apart.
Keep exploring
Related use cases
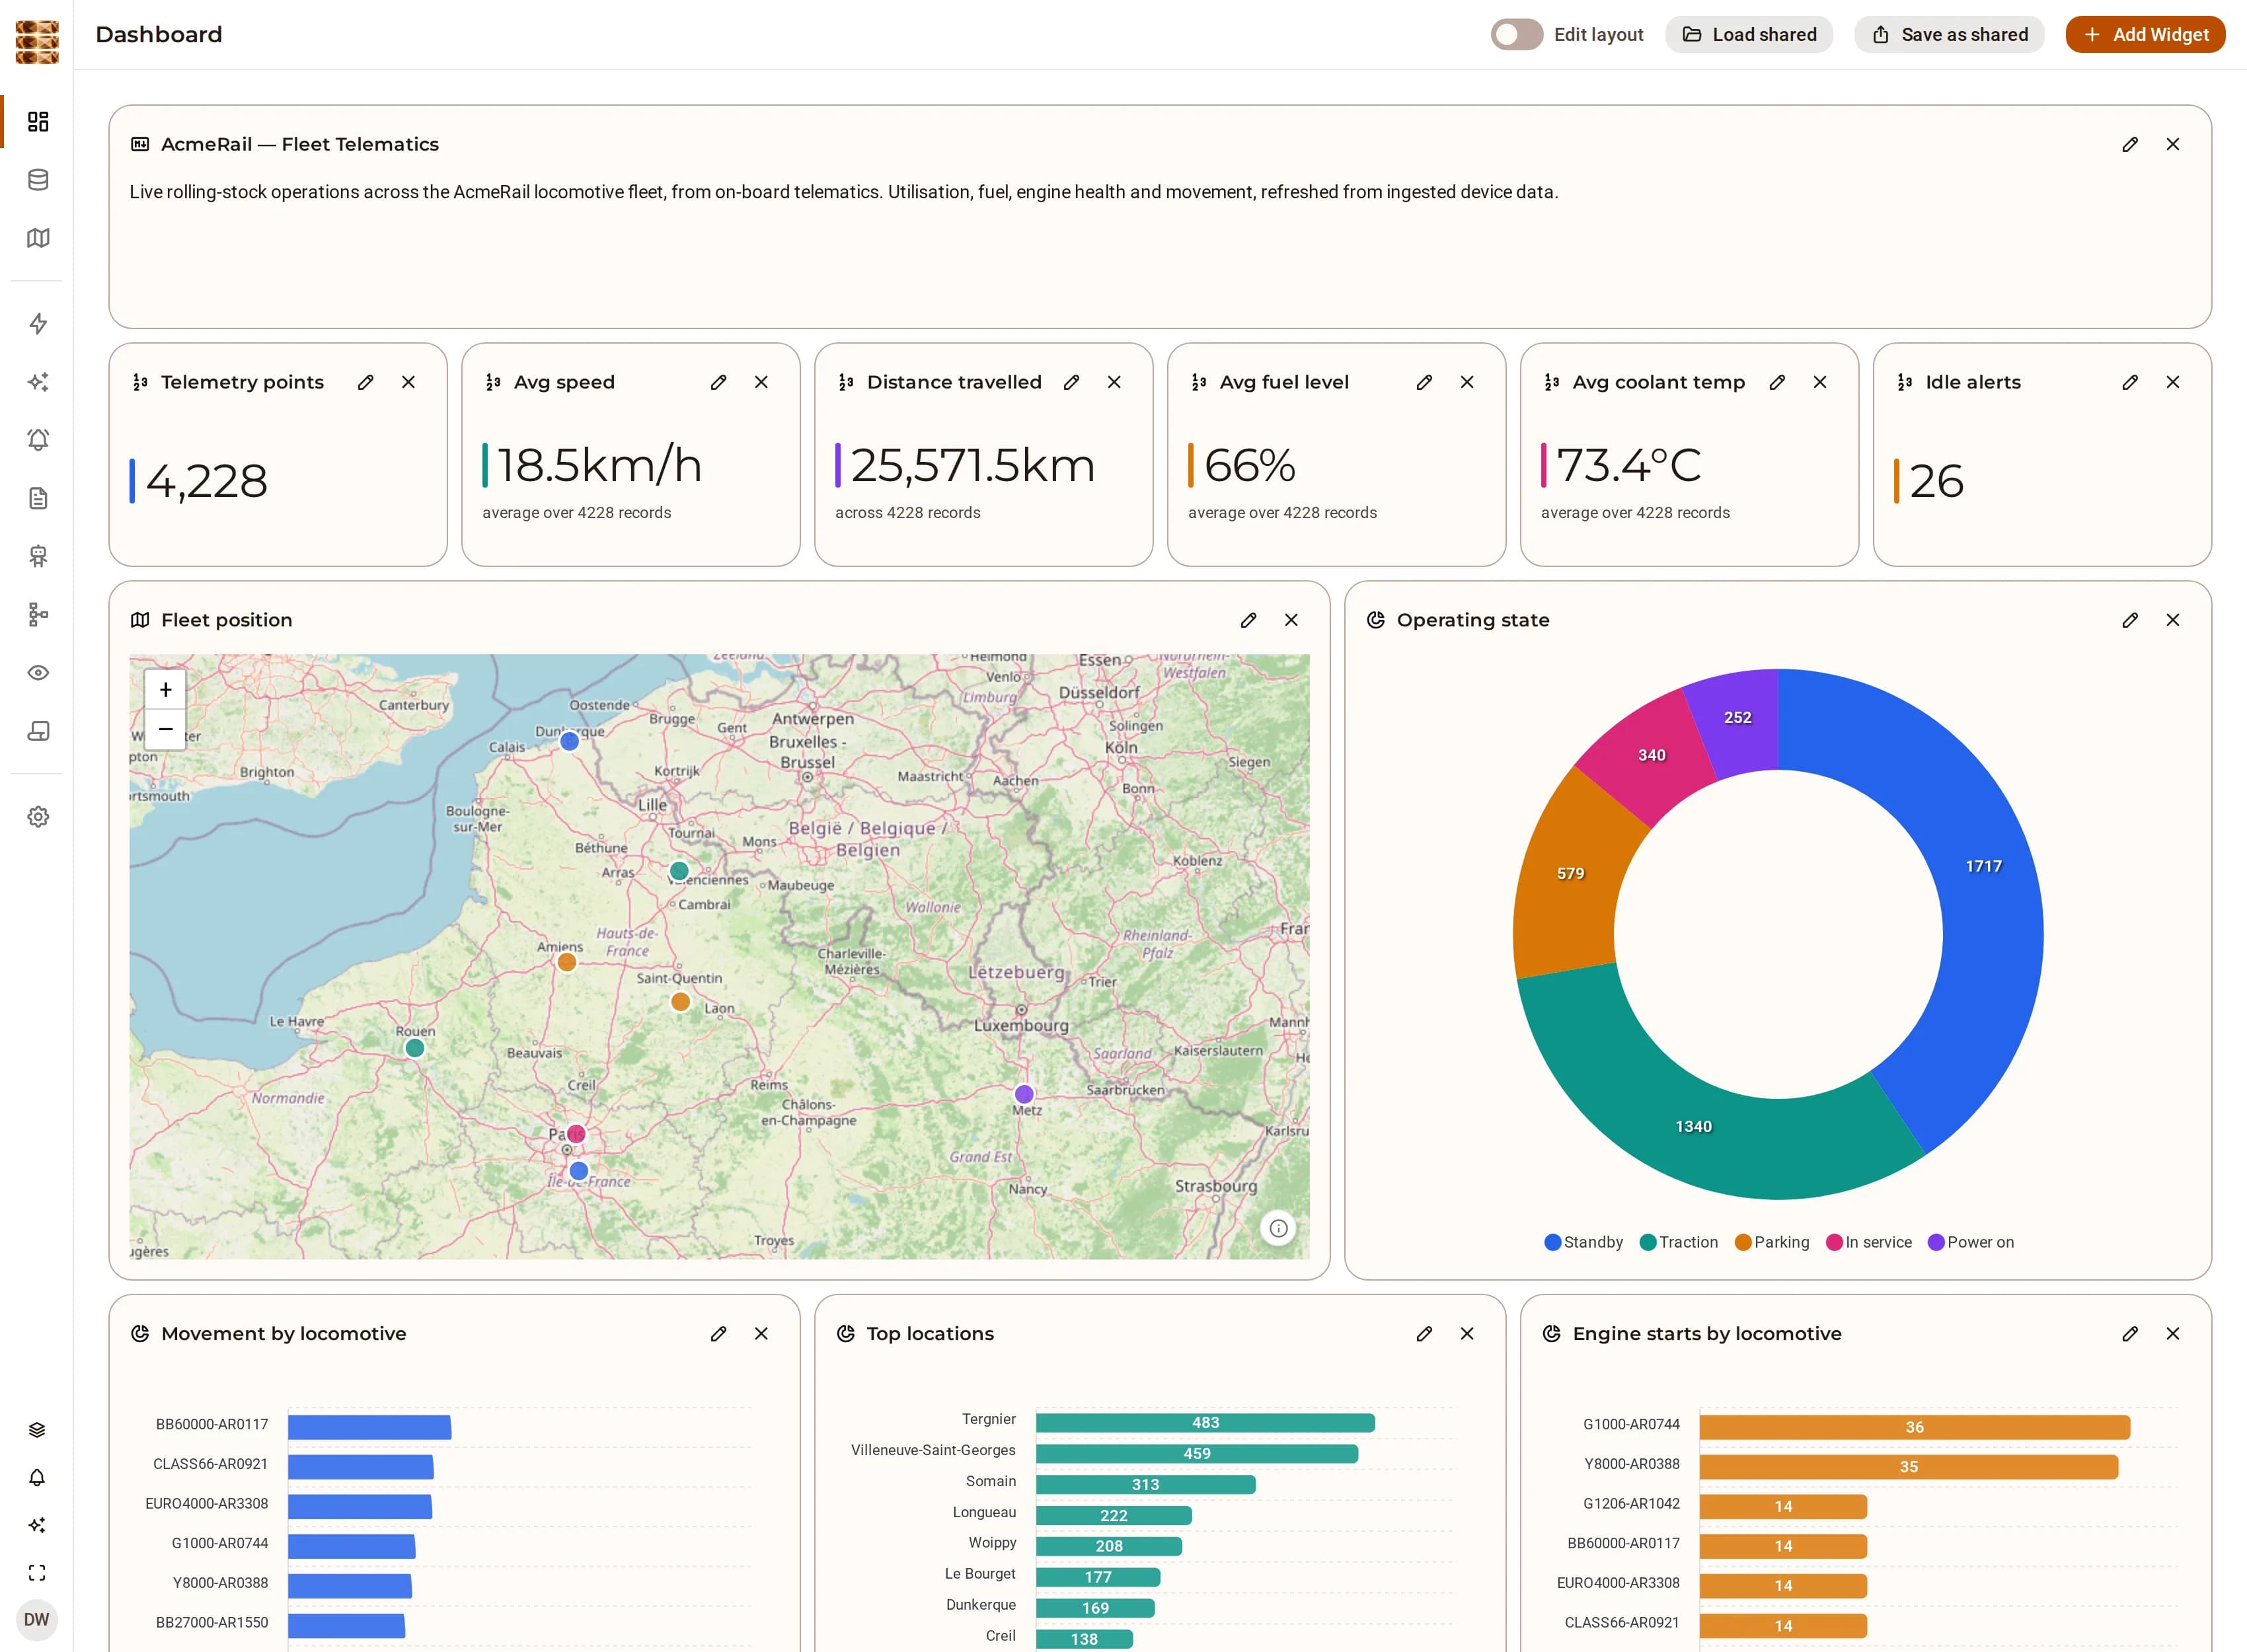 Rail fleet telematicsCondition monitoring for a vehicle fleetTurn a device feed into a fleet you can ask questions about, and a maintenance plan you can defend.
 DjiniousData
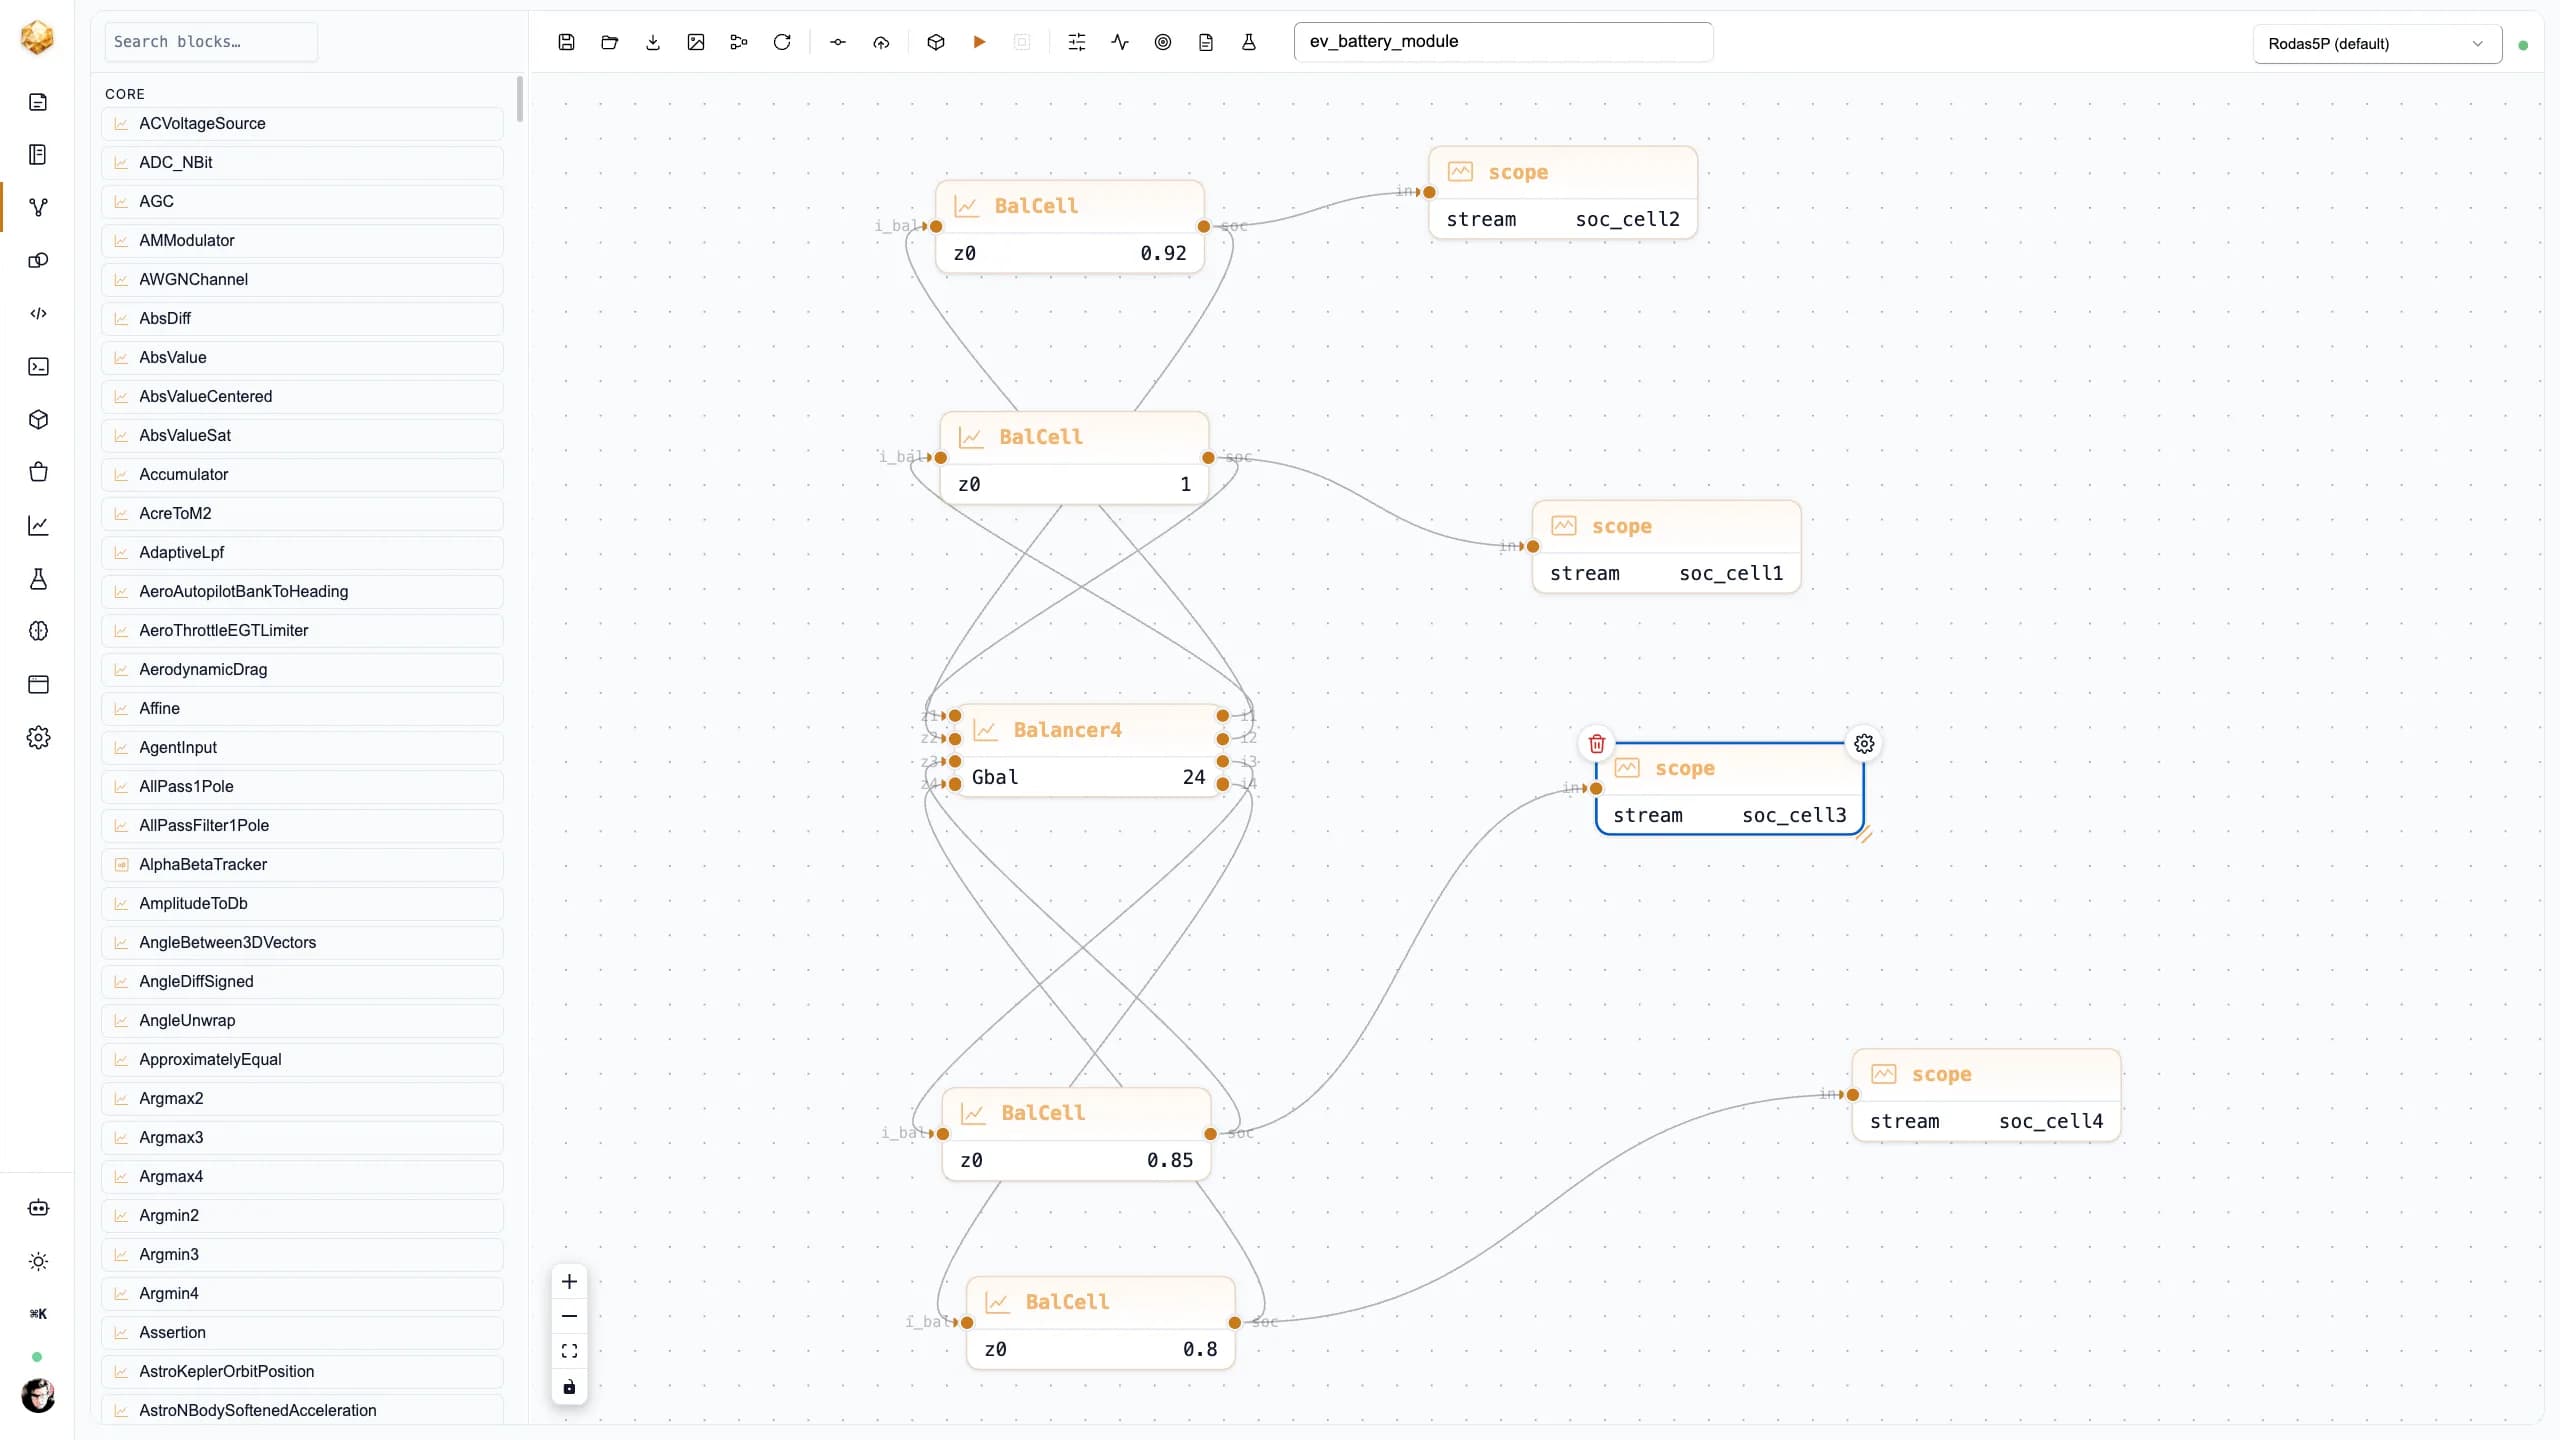 Battery systemsEV battery packAn electric-vehicle battery pack as one multi-domain model — equivalent-circuit cells, a coupled thermal network, a CC-CV charge controller and an active balancer, composed cell → module → pack and run end to end.DjiniousLab
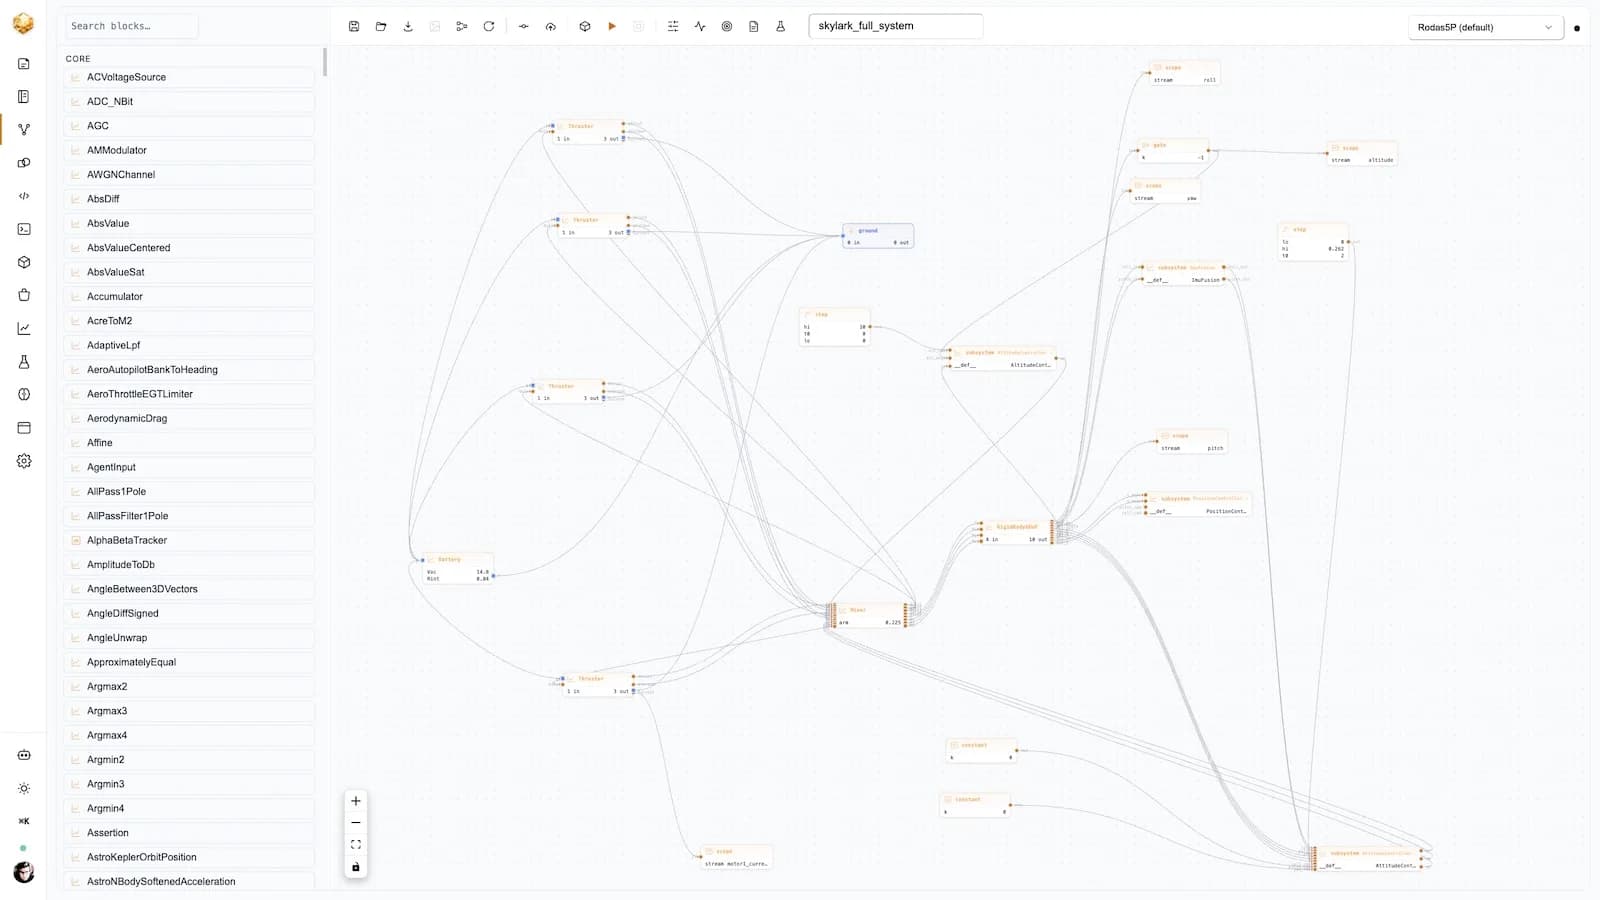 Aerial roboticsDjinborn T4 quadcopterA 450-class survey drone as one multibody composition — airframe, propulsion, sensors, and a cascaded autopilot flying a closed-loop 6-DoF mission.DjiniousLab