 Djinious
Measured summaries
Signal summaries interpolate measured aggregates, never hard-coded figures.
The platform
Each application does one part of the work — and hands its evidence to the next. Use them together, or one at a time.
Platform overviewSee how the loop runs DjiniousEngineeringOrchestration
 DjiniousLabModelling & simulation
 DjiniousWorkshopSystem integration
 DjiniousSafeCertifiable code
 DjiniousWorld3D replicas
 DjiniousMapAgent GIS
 DjiniousCCOperations & SCADA
 DjiniousDataKnowledge base
 DjiniousWorkflowAgent automation
Turn a device feed into a fleet you can ask questions about, and a maintenance plan you can defend.
 DjiniousData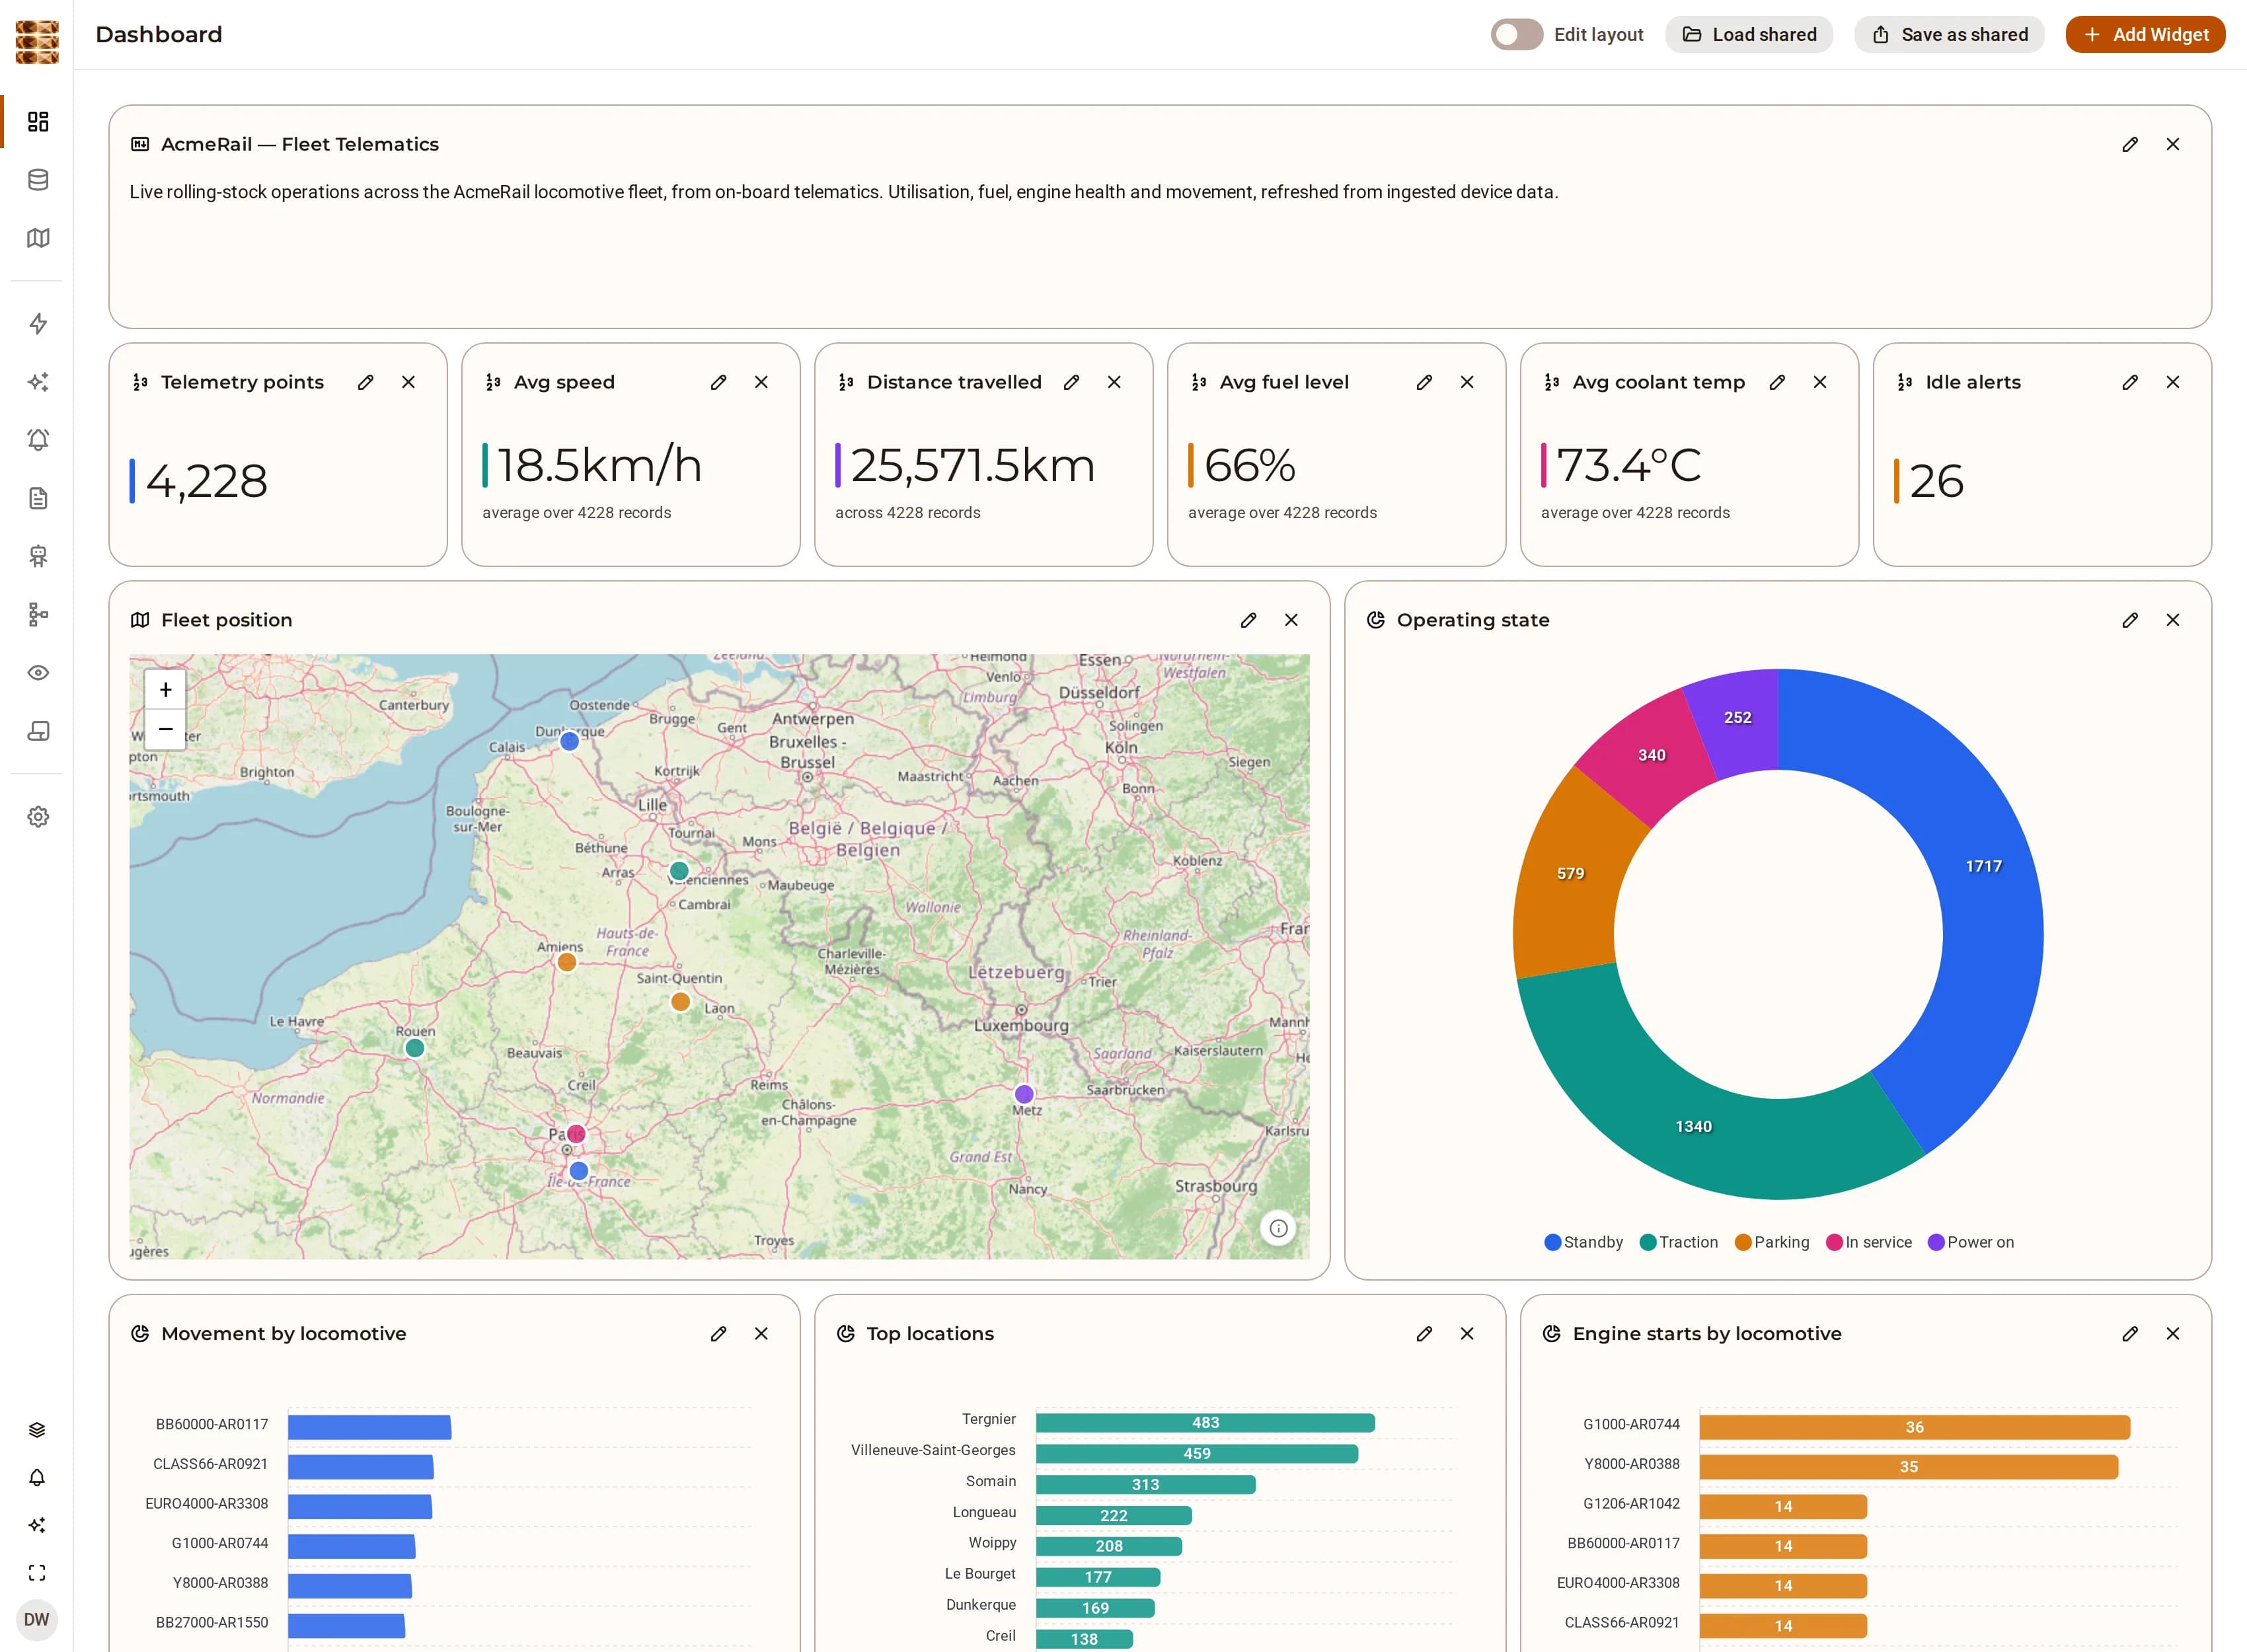
Eight locomotives report position, engine load, coolant temperature and bus voltage; a depot CMMS carries two years of work orders against the same units. Modelled as locomotives, places and fleet events, the two become one picture: which unit is over its overhaul interval, which is overheating, which has not moved in a fortnight — each answer opening onto the readings behind it.
AcmeRail is a fictional freight operator seeded into the development stack. Its fleet, its depots, its telematics vendor and its CMMS are invented; the ingest that loaded them, the ontology that models them and the findings drawn from them are the product’s own.
Ingest the device feed and the work-order export; both land as knowledge objects with provenance.
File ingestModel locomotive, place, fleet and fleet event as types, at runtime.
Runtime ontologyMaterialize the units from their own latest telemetry and relate them into a fleet graph.
Knowledge graphPut threshold rules on coolant and bus voltage, per unit, and let the findings open investigations.
Alert rulesThe places are the ones the telemetry named; the edges are what it supports.
DjiniousData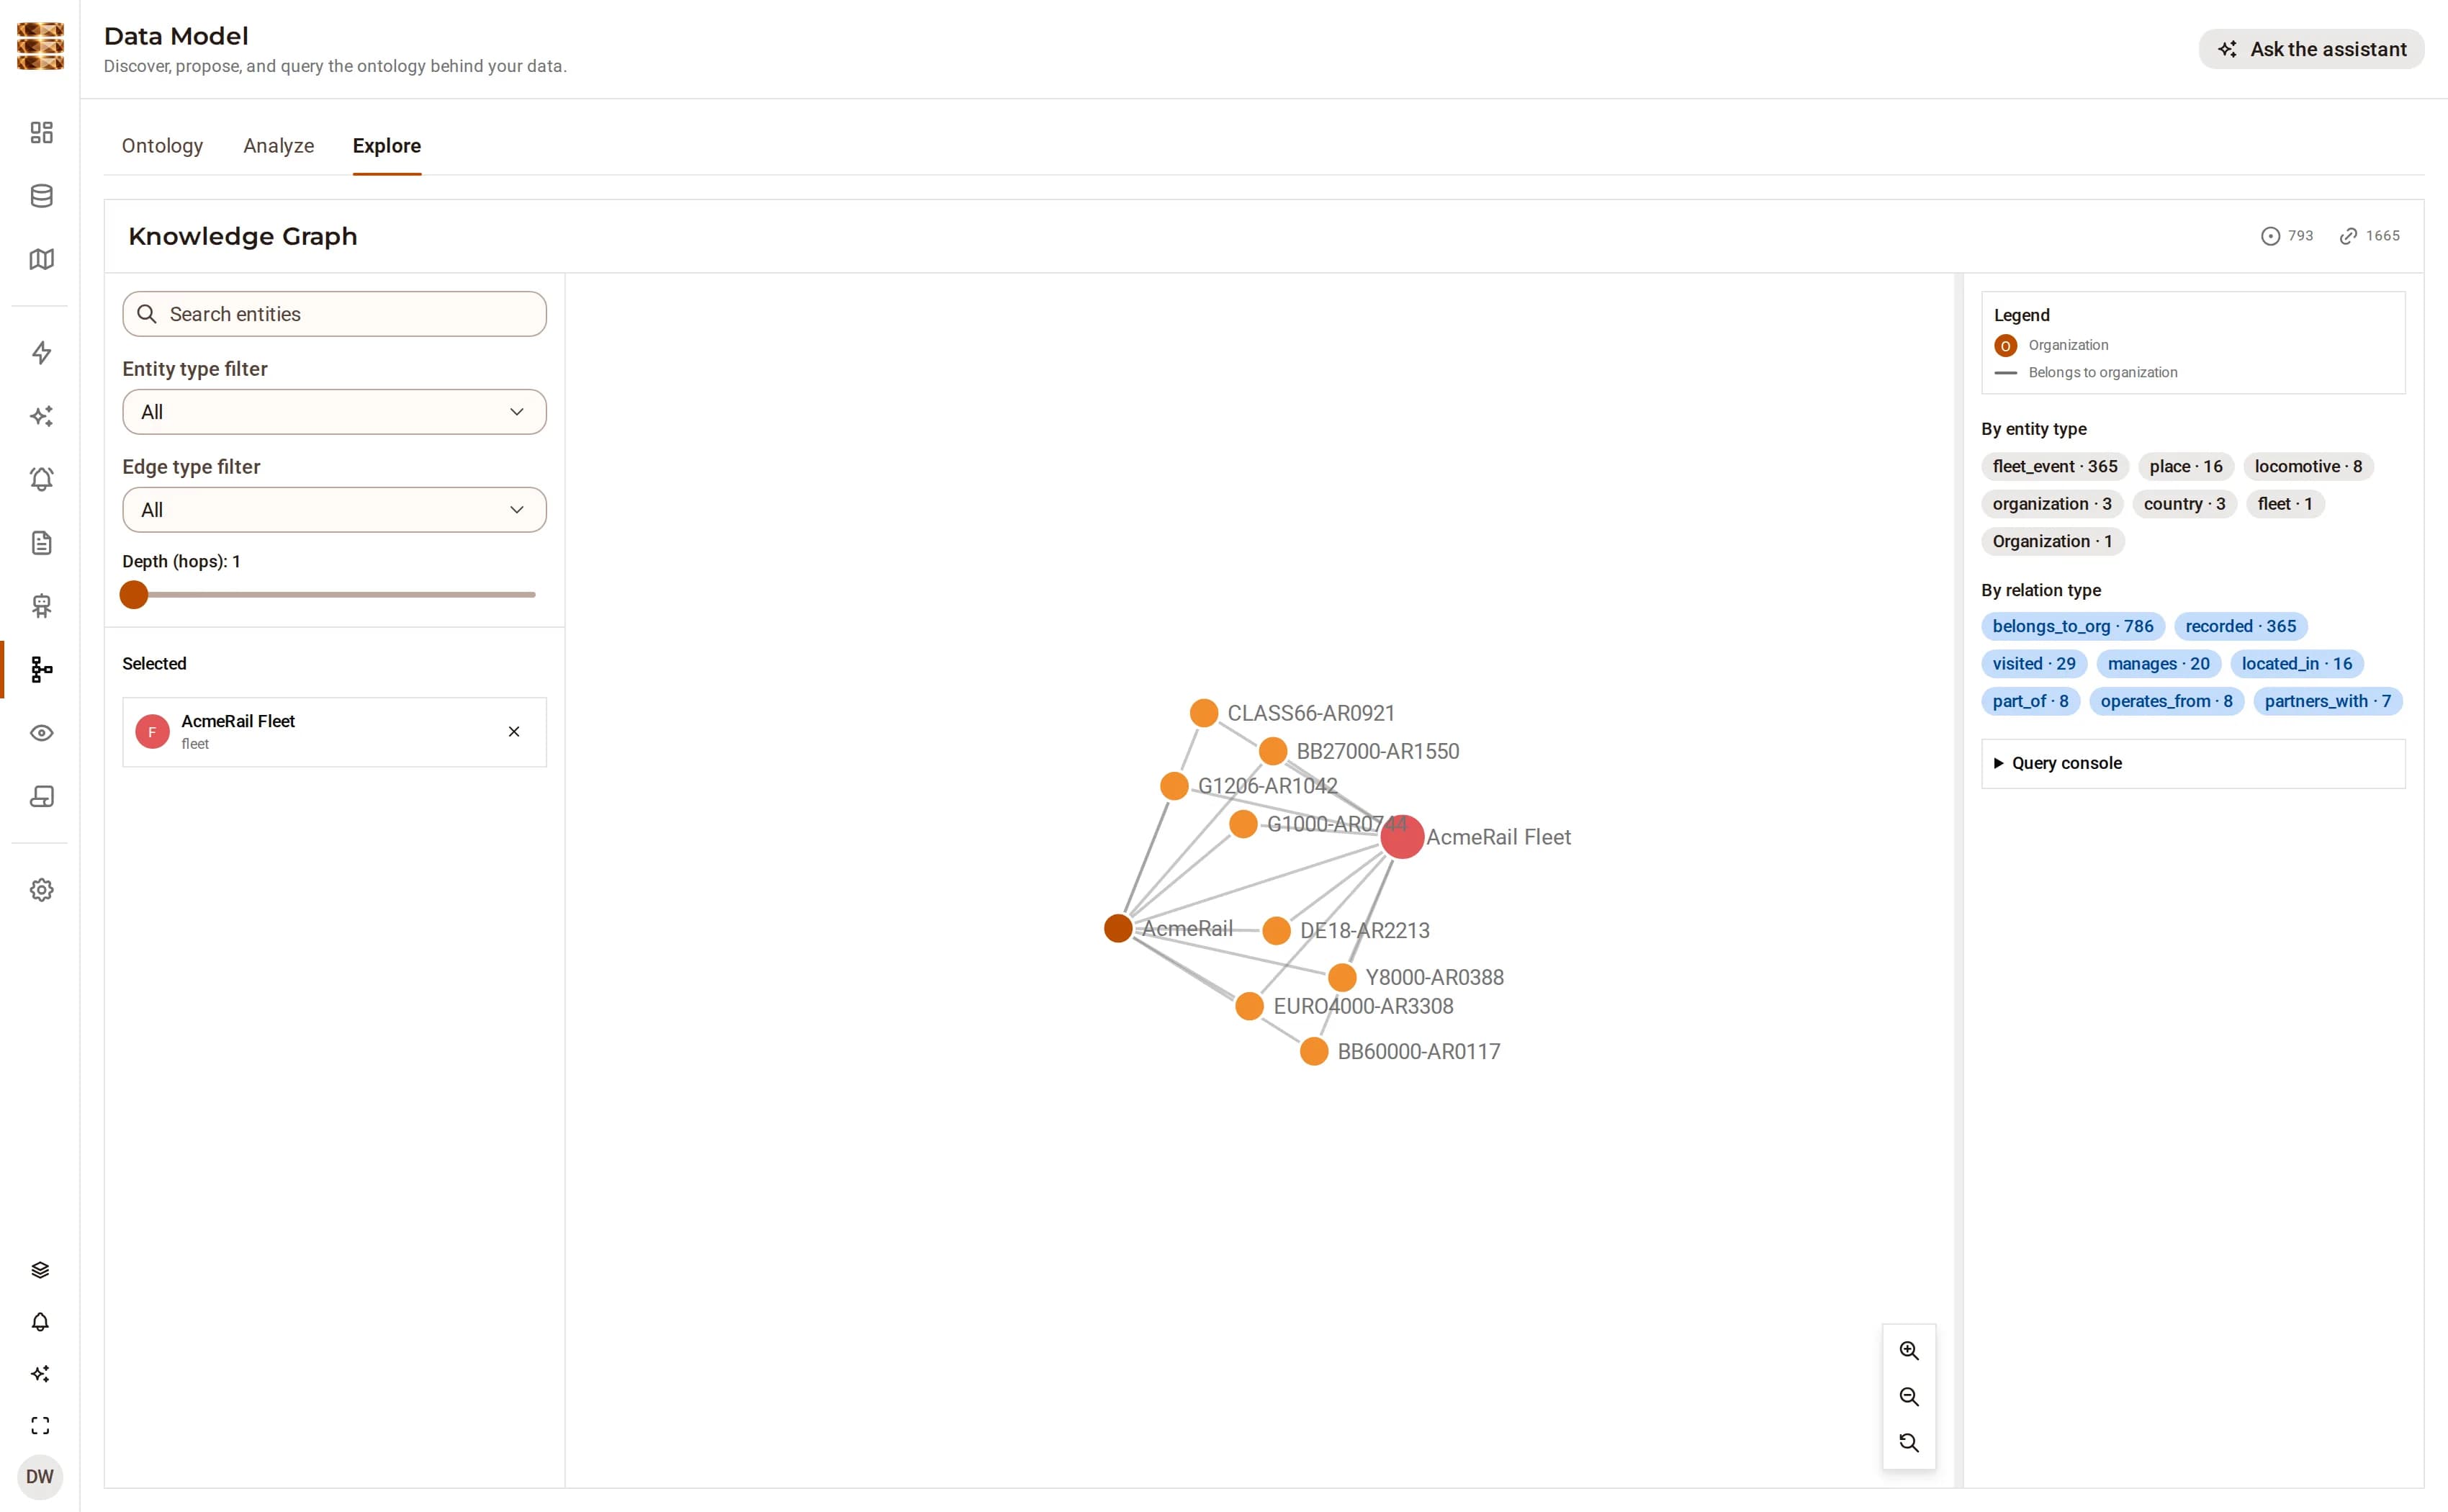
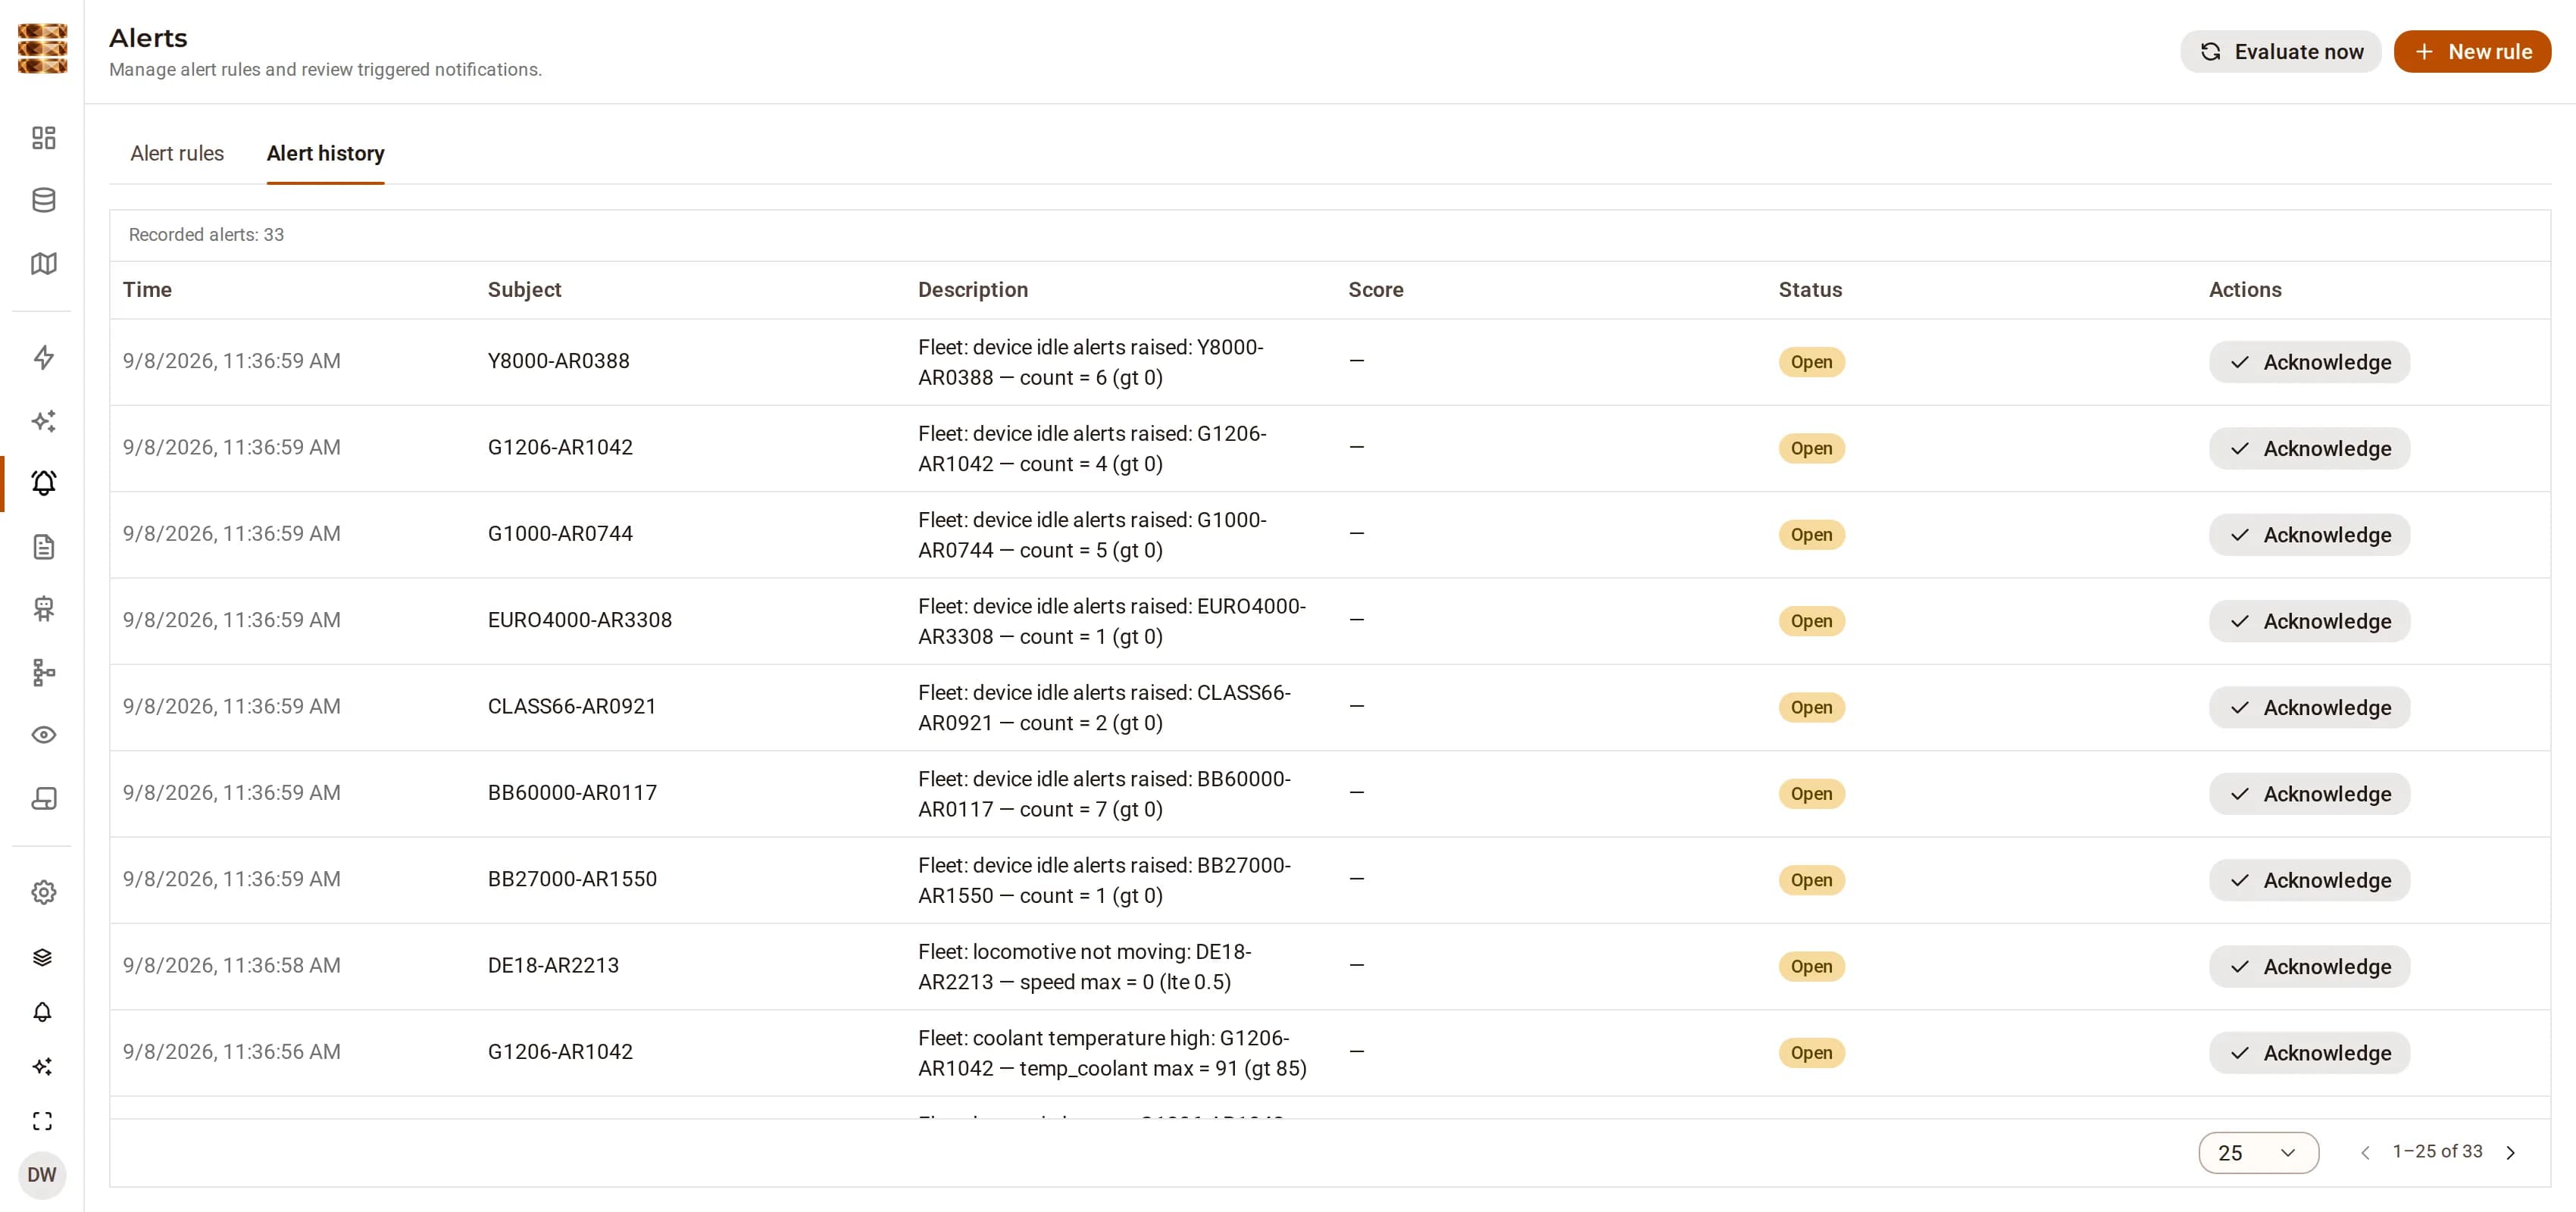
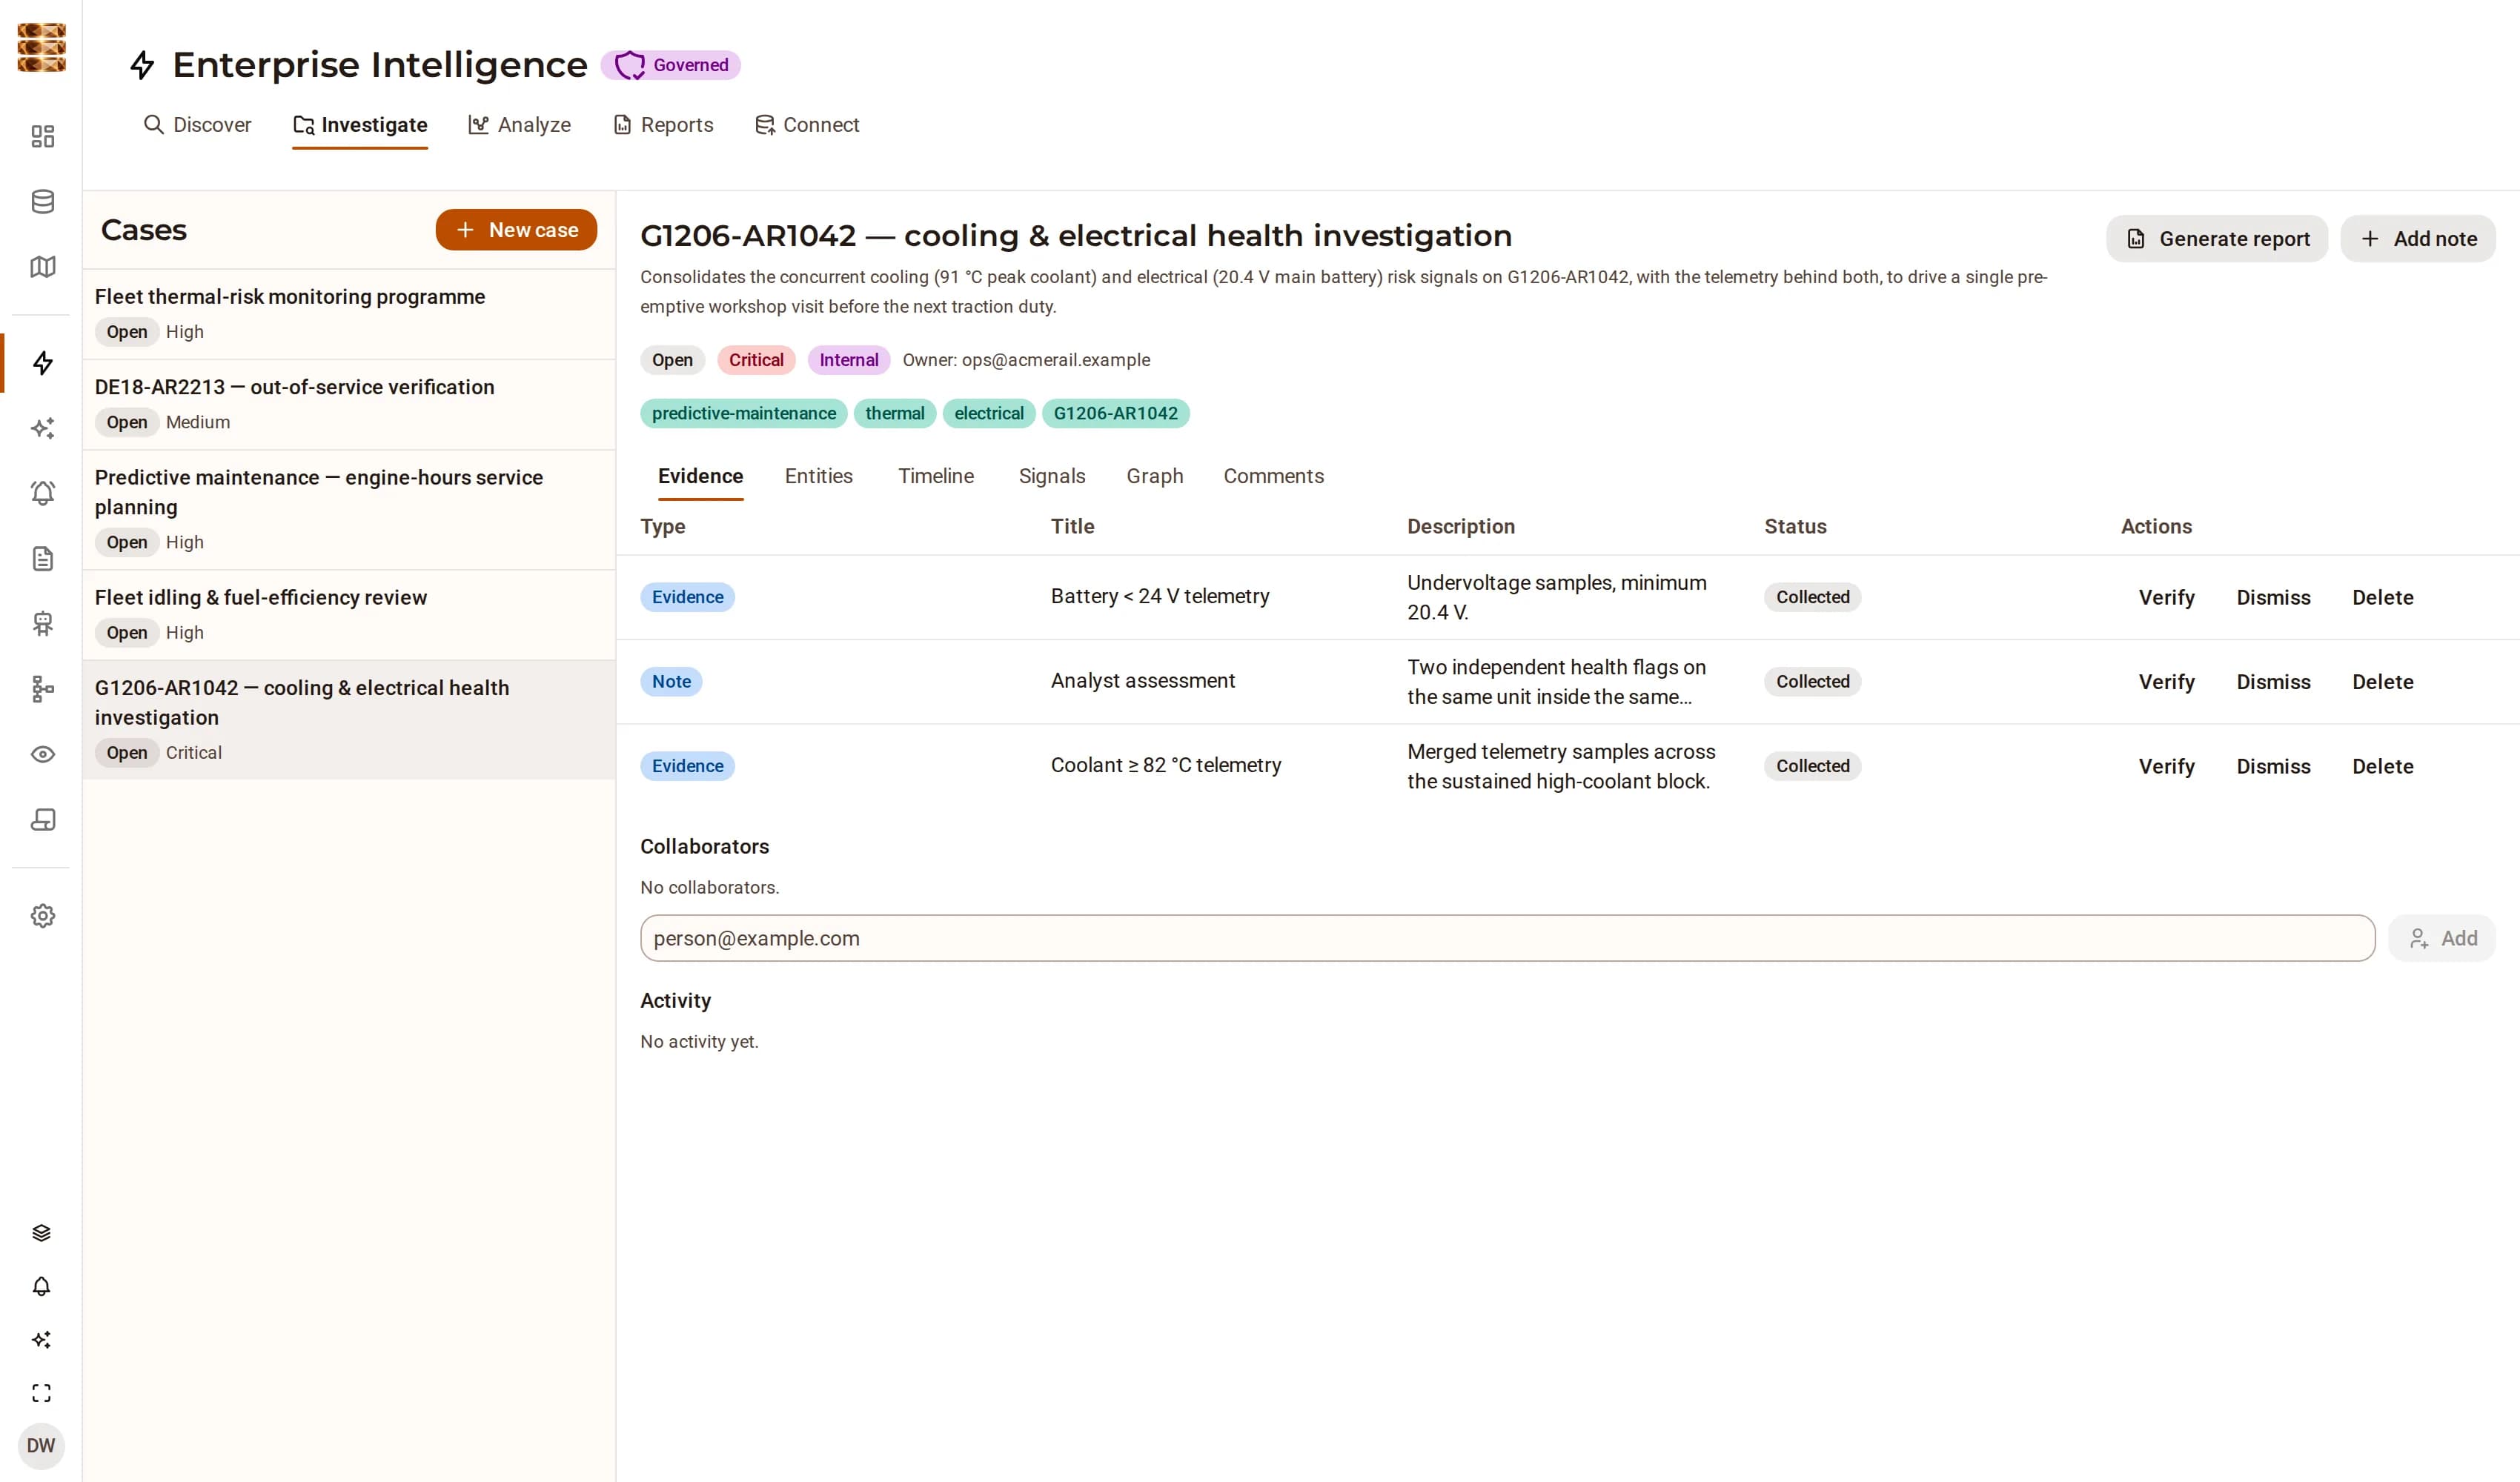
The findings in the captures are not written copy. The seed reads the ingested telemetry, computes the fleet’s actual engine hours, peak coolant temperatures and minimum bus voltages, and composes the finding text from those numbers.
Signal summaries interpolate measured aggregates, never hard-coded figures.
Each signal carries references to the knowledge objects it was drawn from.
The alert thresholds are set against the measured fleet, so the seeded stack ships with real firings rather than four rules that have never fired.
One locomotive breaches both the thermal and the electrical rule — the same unit the investigation case and the deep-dive report are about.
DjiniousData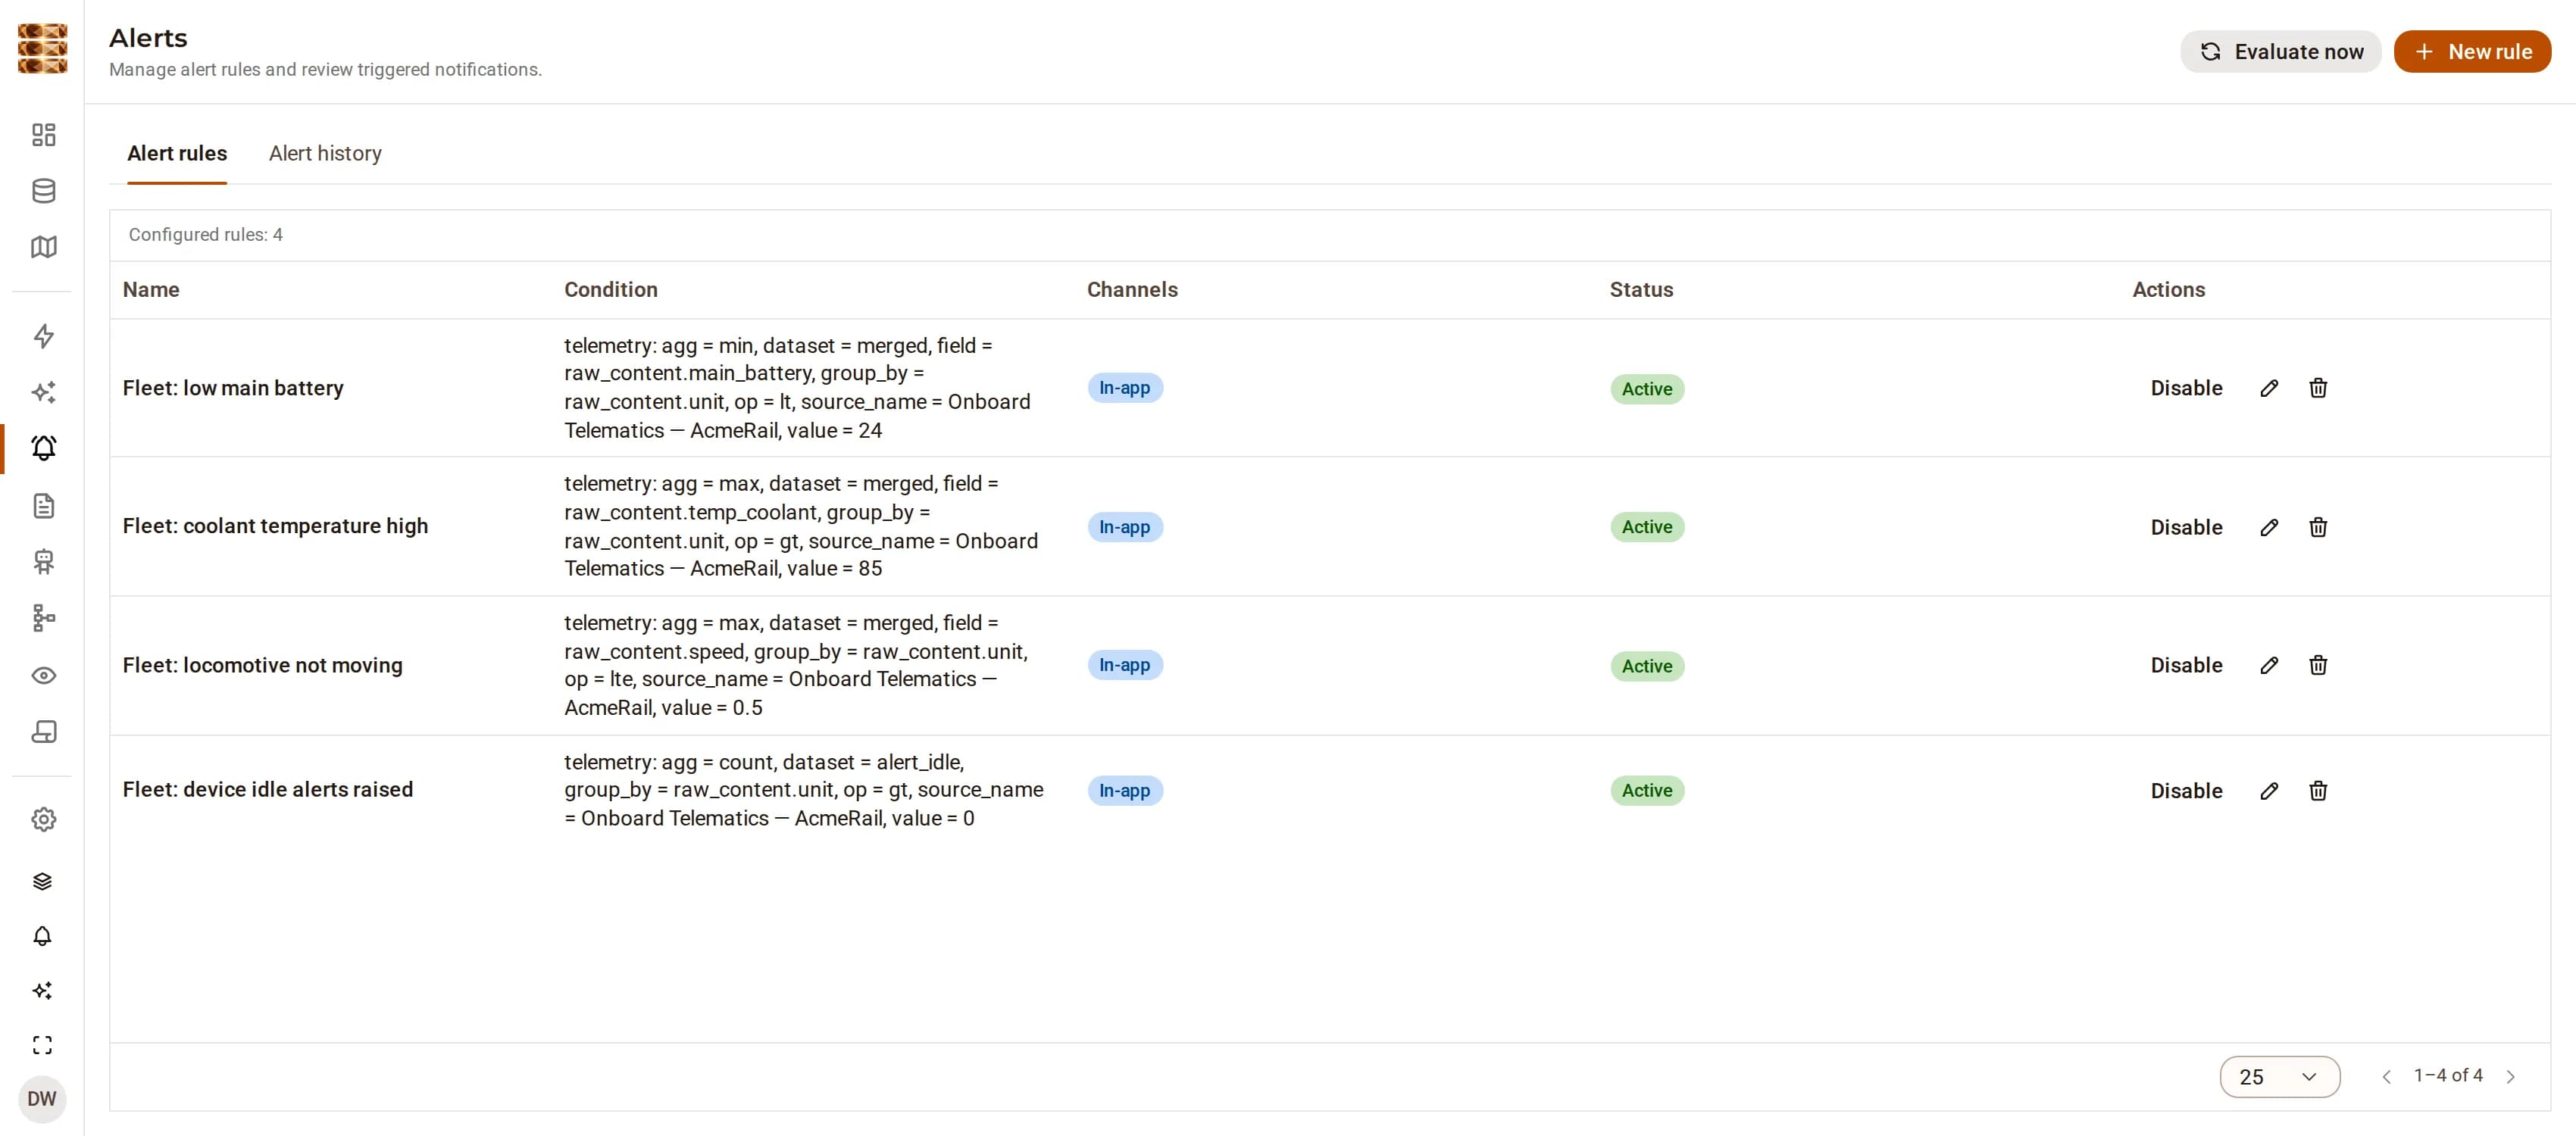 DjiniousData
 DjiniousData
 DjiniousData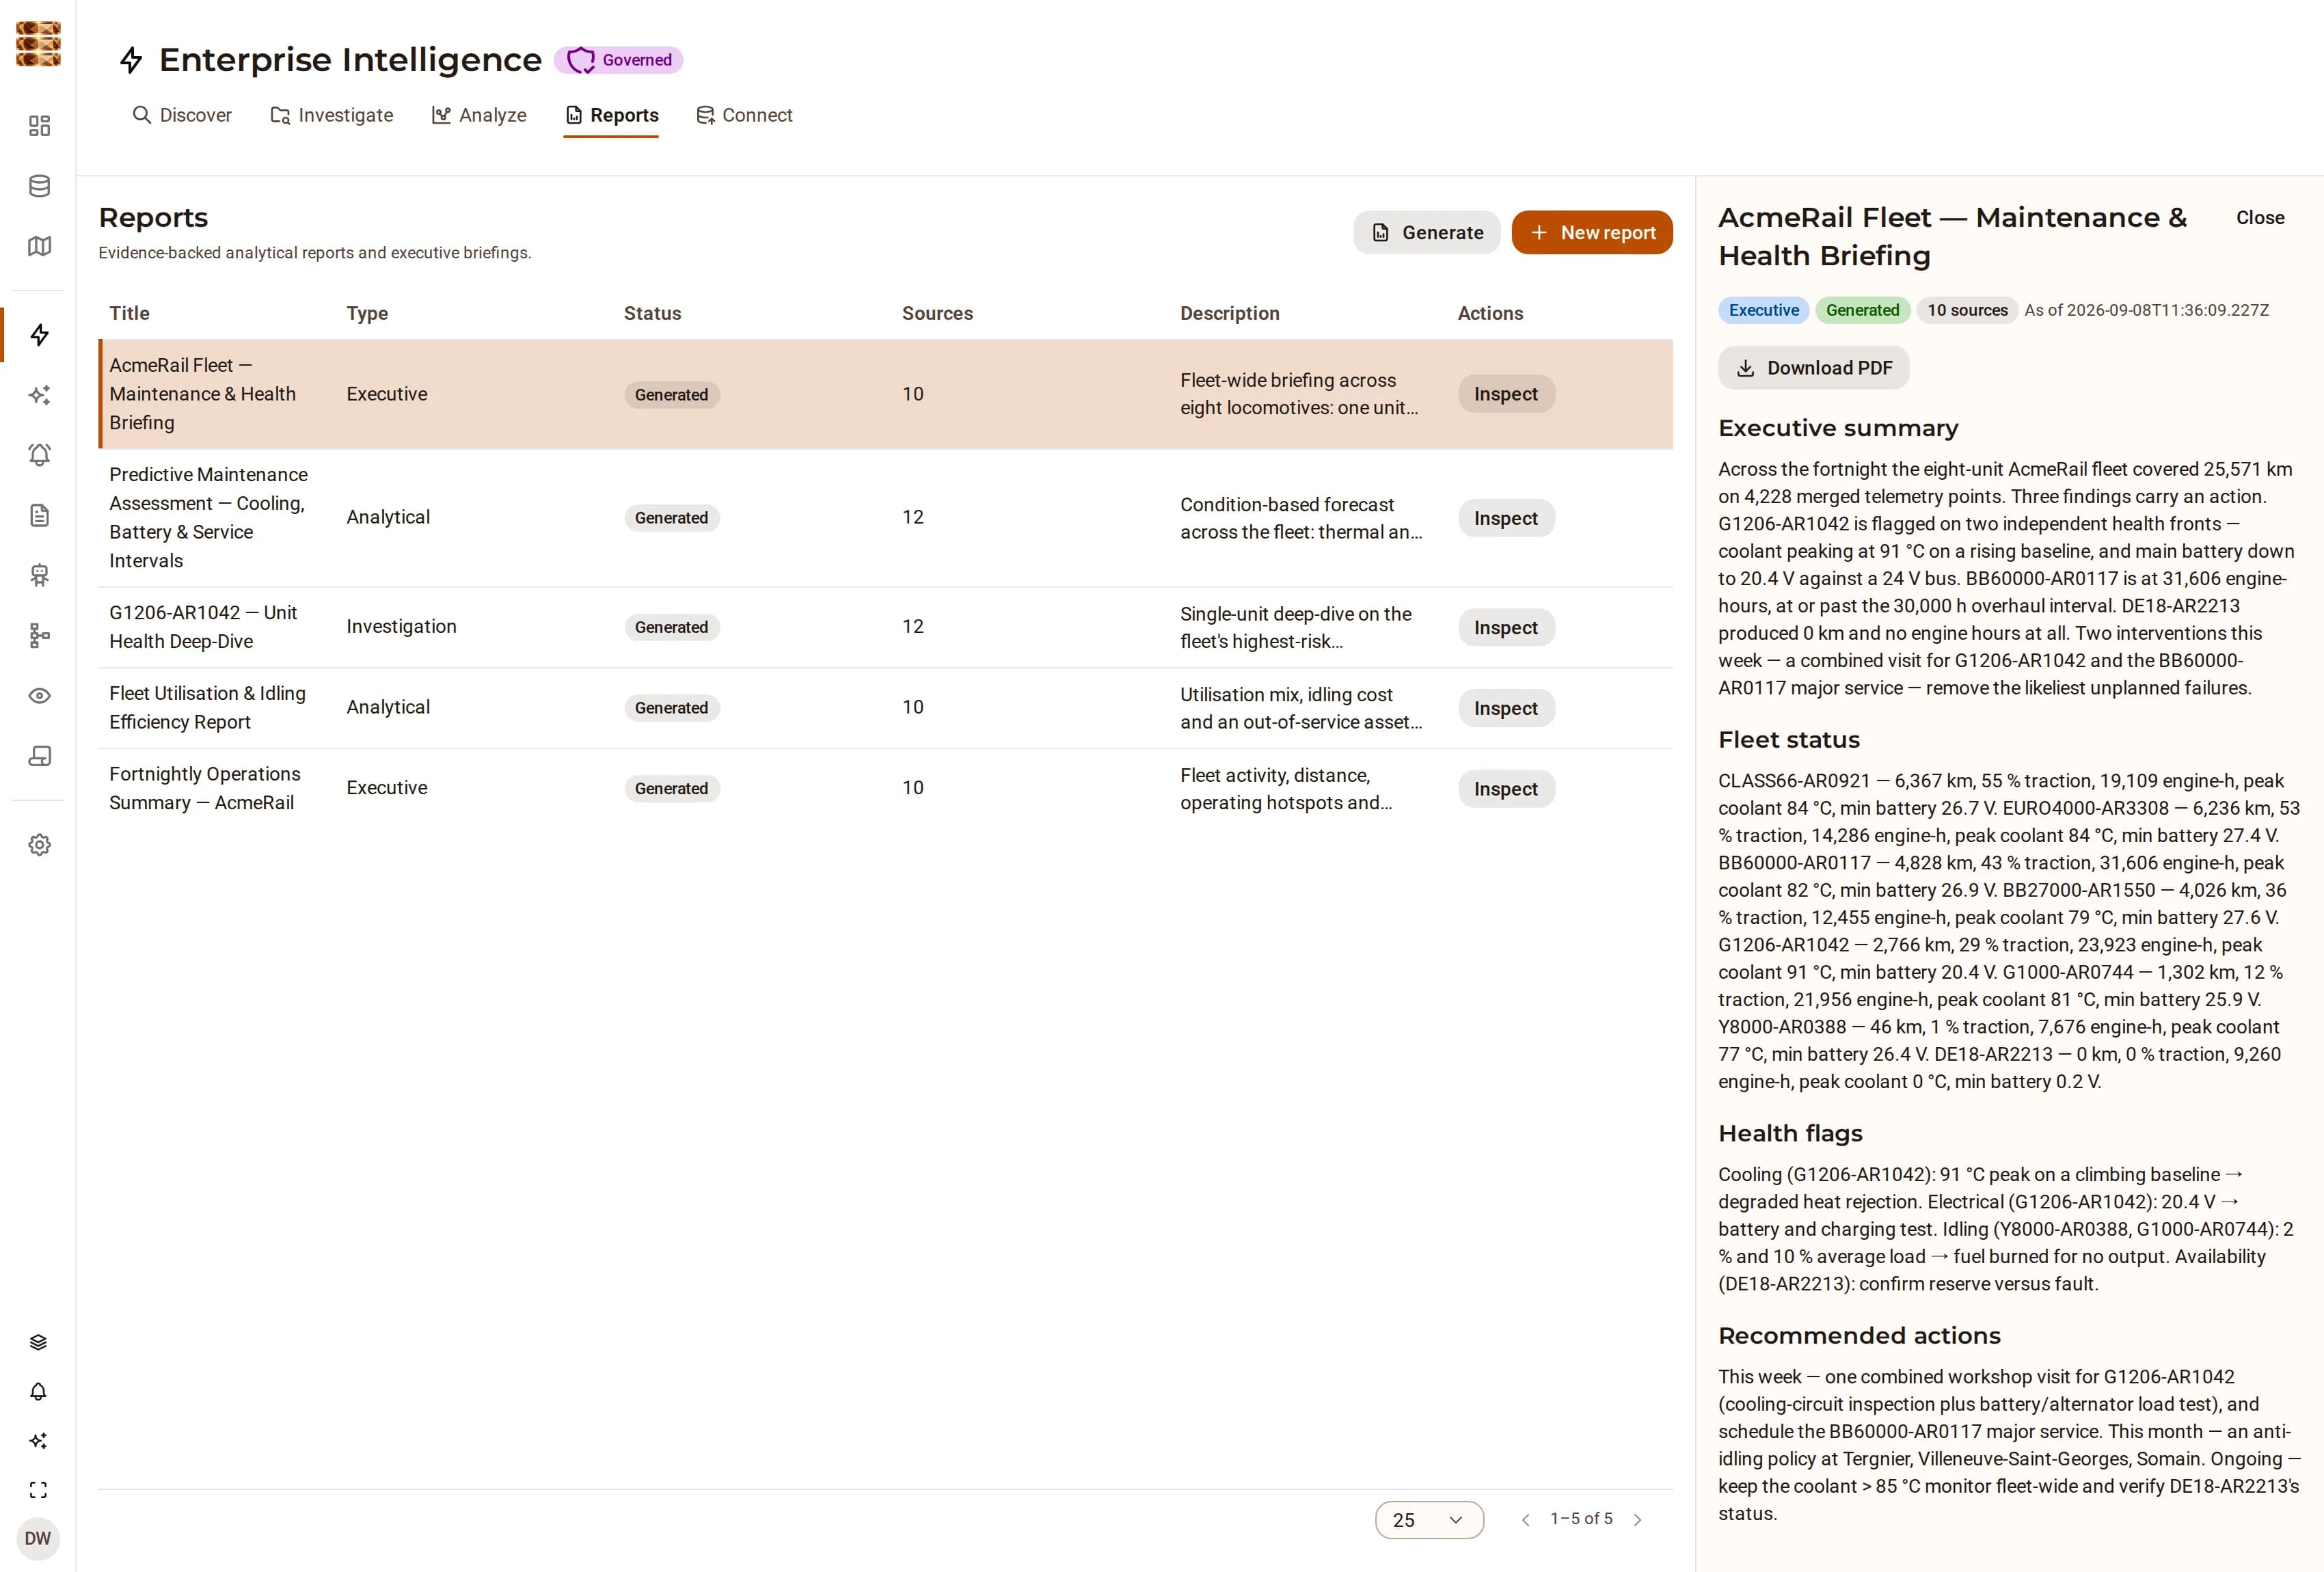
Keep exploring
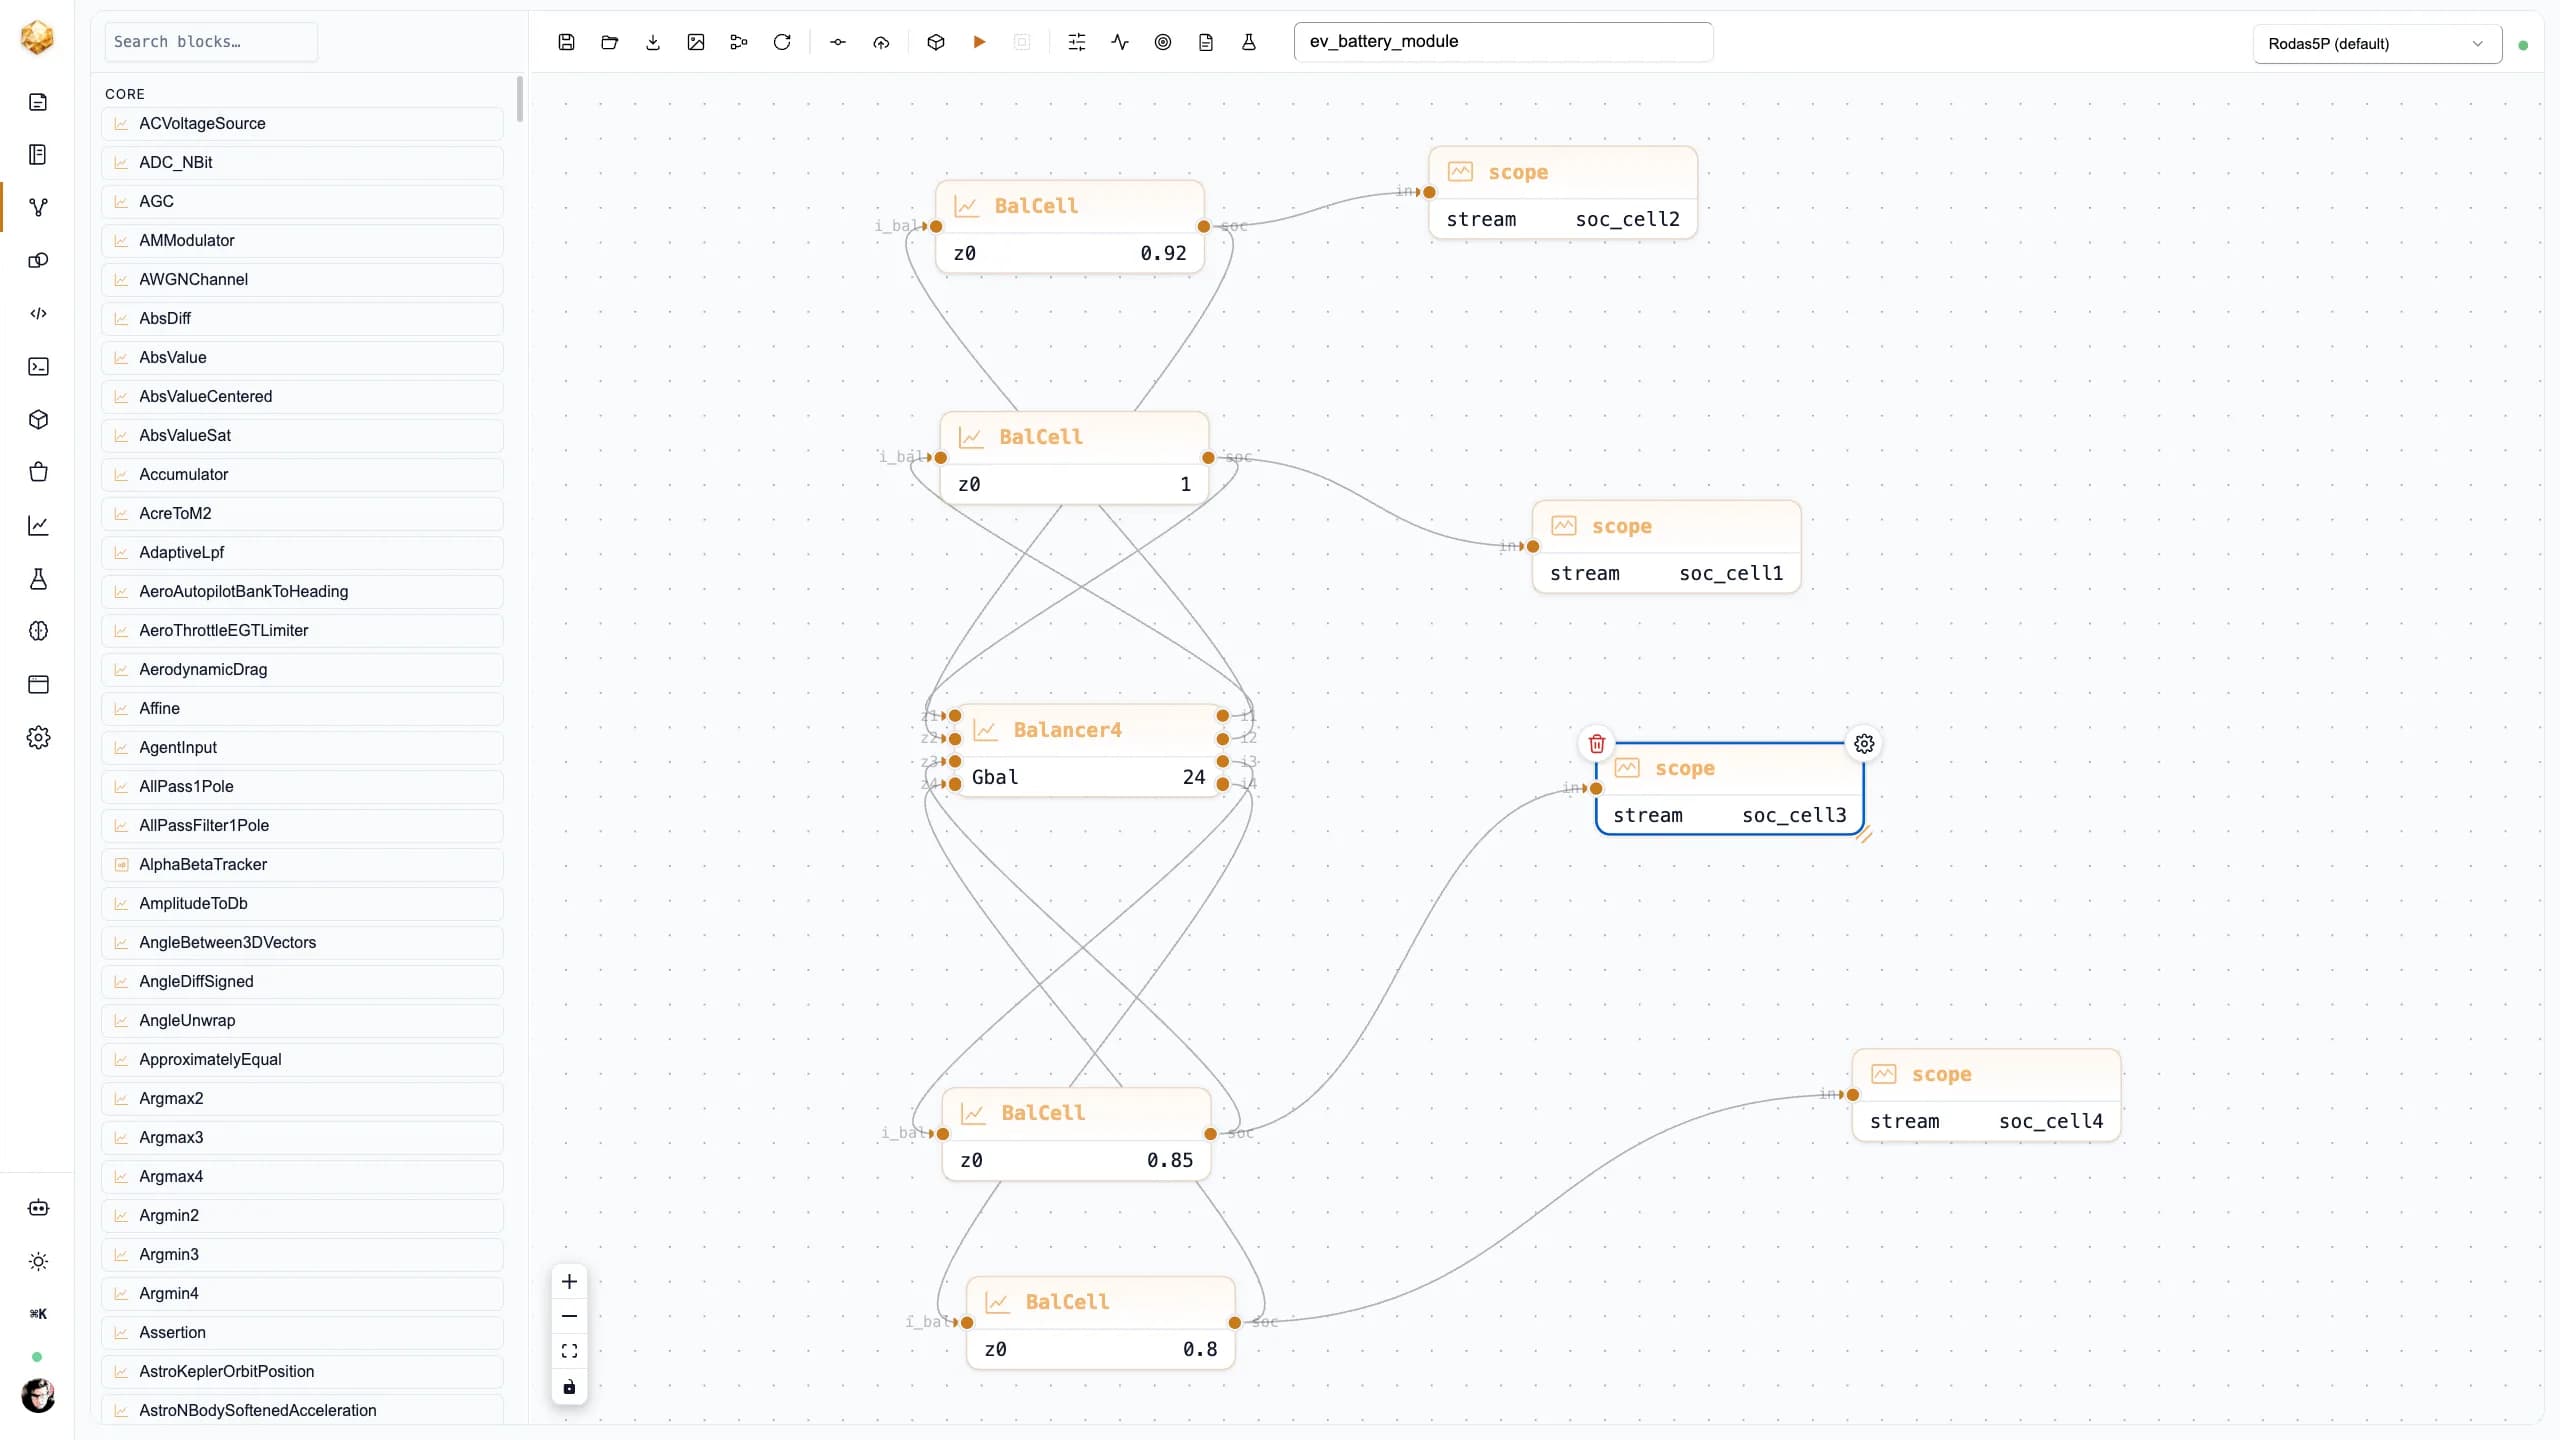 Battery systemsEV battery packAn electric-vehicle battery pack as one multi-domain model — equivalent-circuit cells, a coupled thermal network, a CC-CV charge controller and an active balancer, composed cell → module → pack and run end to end.
 DjiniousLab
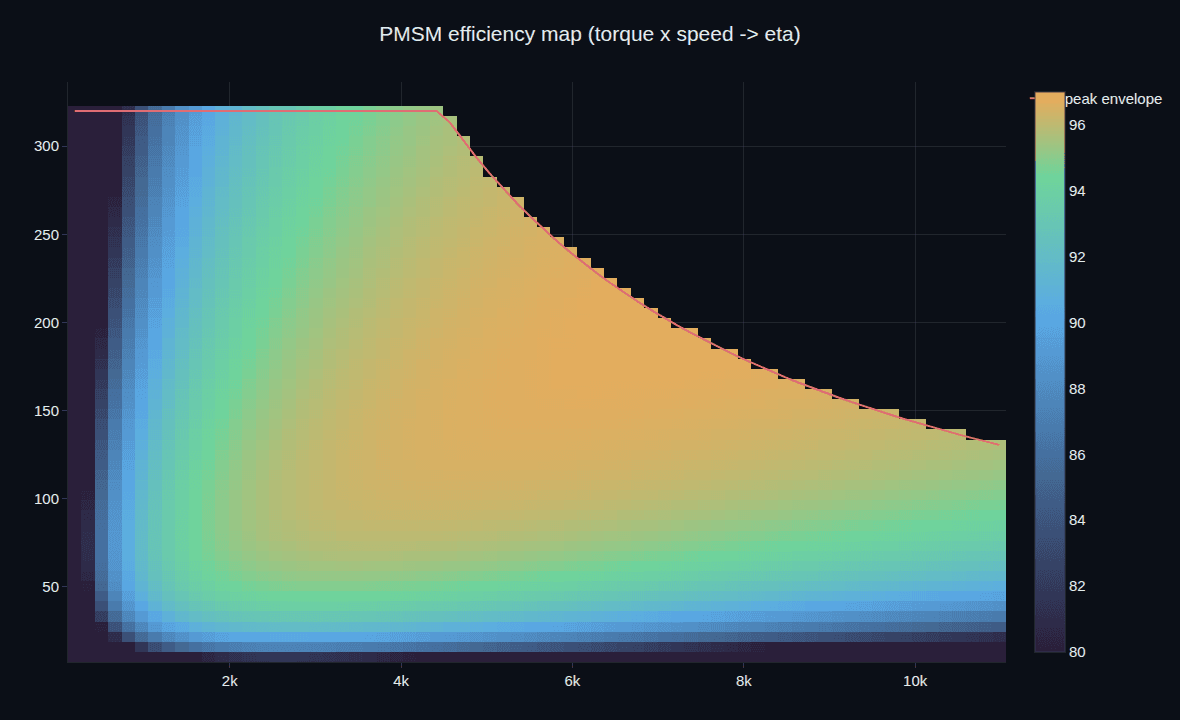 Electric vehiclesFull EV vehicleThe battery pack you sized becomes the car you drive — a complete electric vehicle over the WLTP cycle: drive cycle, traction motor, regen, the battery over the cycle, thermal, and the numbers that sell a car — range, consumption, and 0–100.DjiniousLabDocument intelligenceMaking a document archive answerableA shared drive nobody can query becomes a searchable, cited corpus without a migration project.DjiniousData